Demand & S&OP
Plan with confidence.
Turn fragmented market signals into one feasible supply plan — with the assumptions, the constraints and the consensus of every function in plain view.
Turn fragmented market signals into one feasible supply plan — with the assumptions, the constraints and the consensus of every function in plain view.
The forecast is drawn against actuals with a confidence band, and the lift from a promotion is isolated, so the plan does not chase a one-off spike.
When supply cannot cover demand in weeks 48–50, the planner tests 24 options and proposes one — overtime on a line, an order pulled forward, stock moved between warehouses — with its service, cost and margin impact shown.
Each function reviews the same plan in one place, so the cycle closes with a signed-off version instead of a pile of spreadsheets.
Use the menu on the left, or the tabs below — every screen is a page of the product, with sample data.
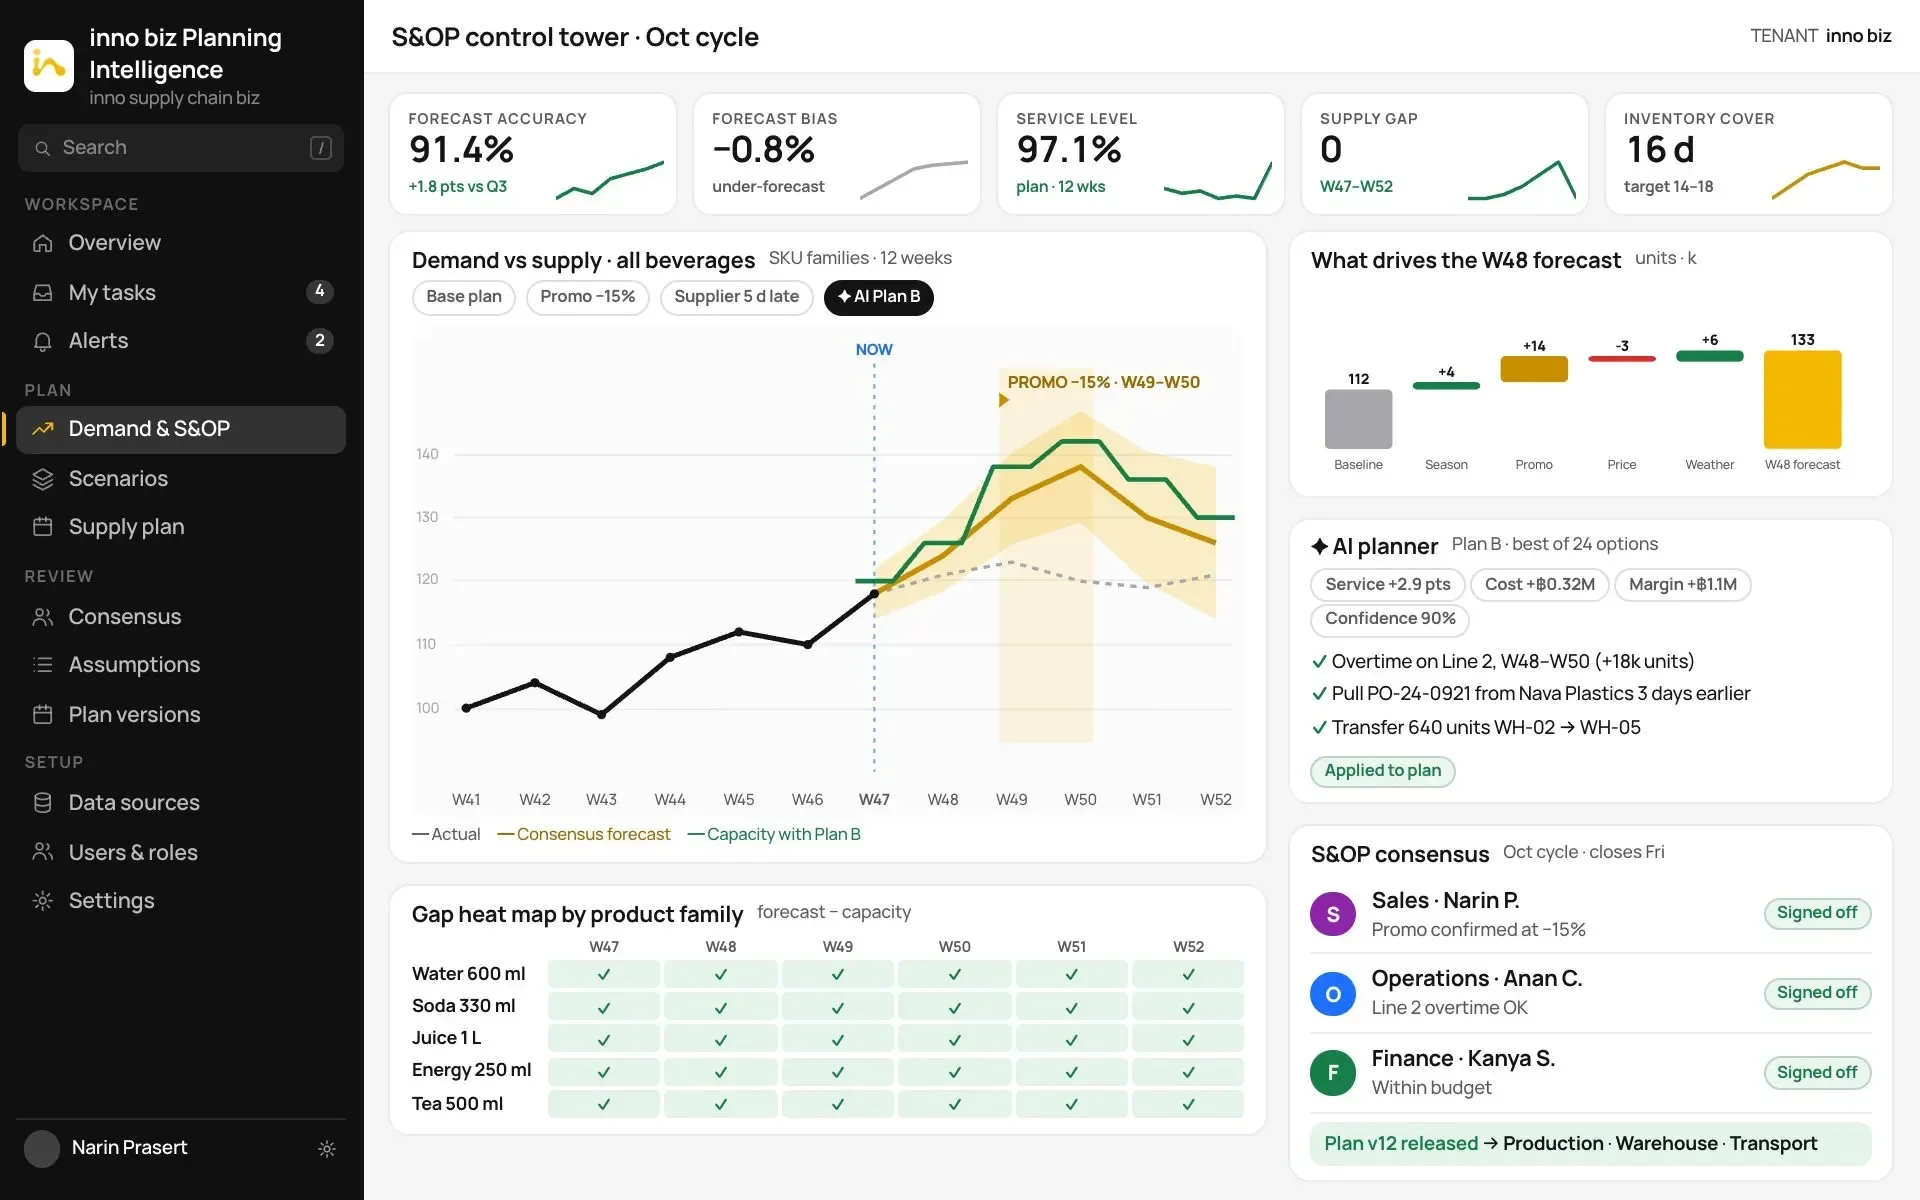
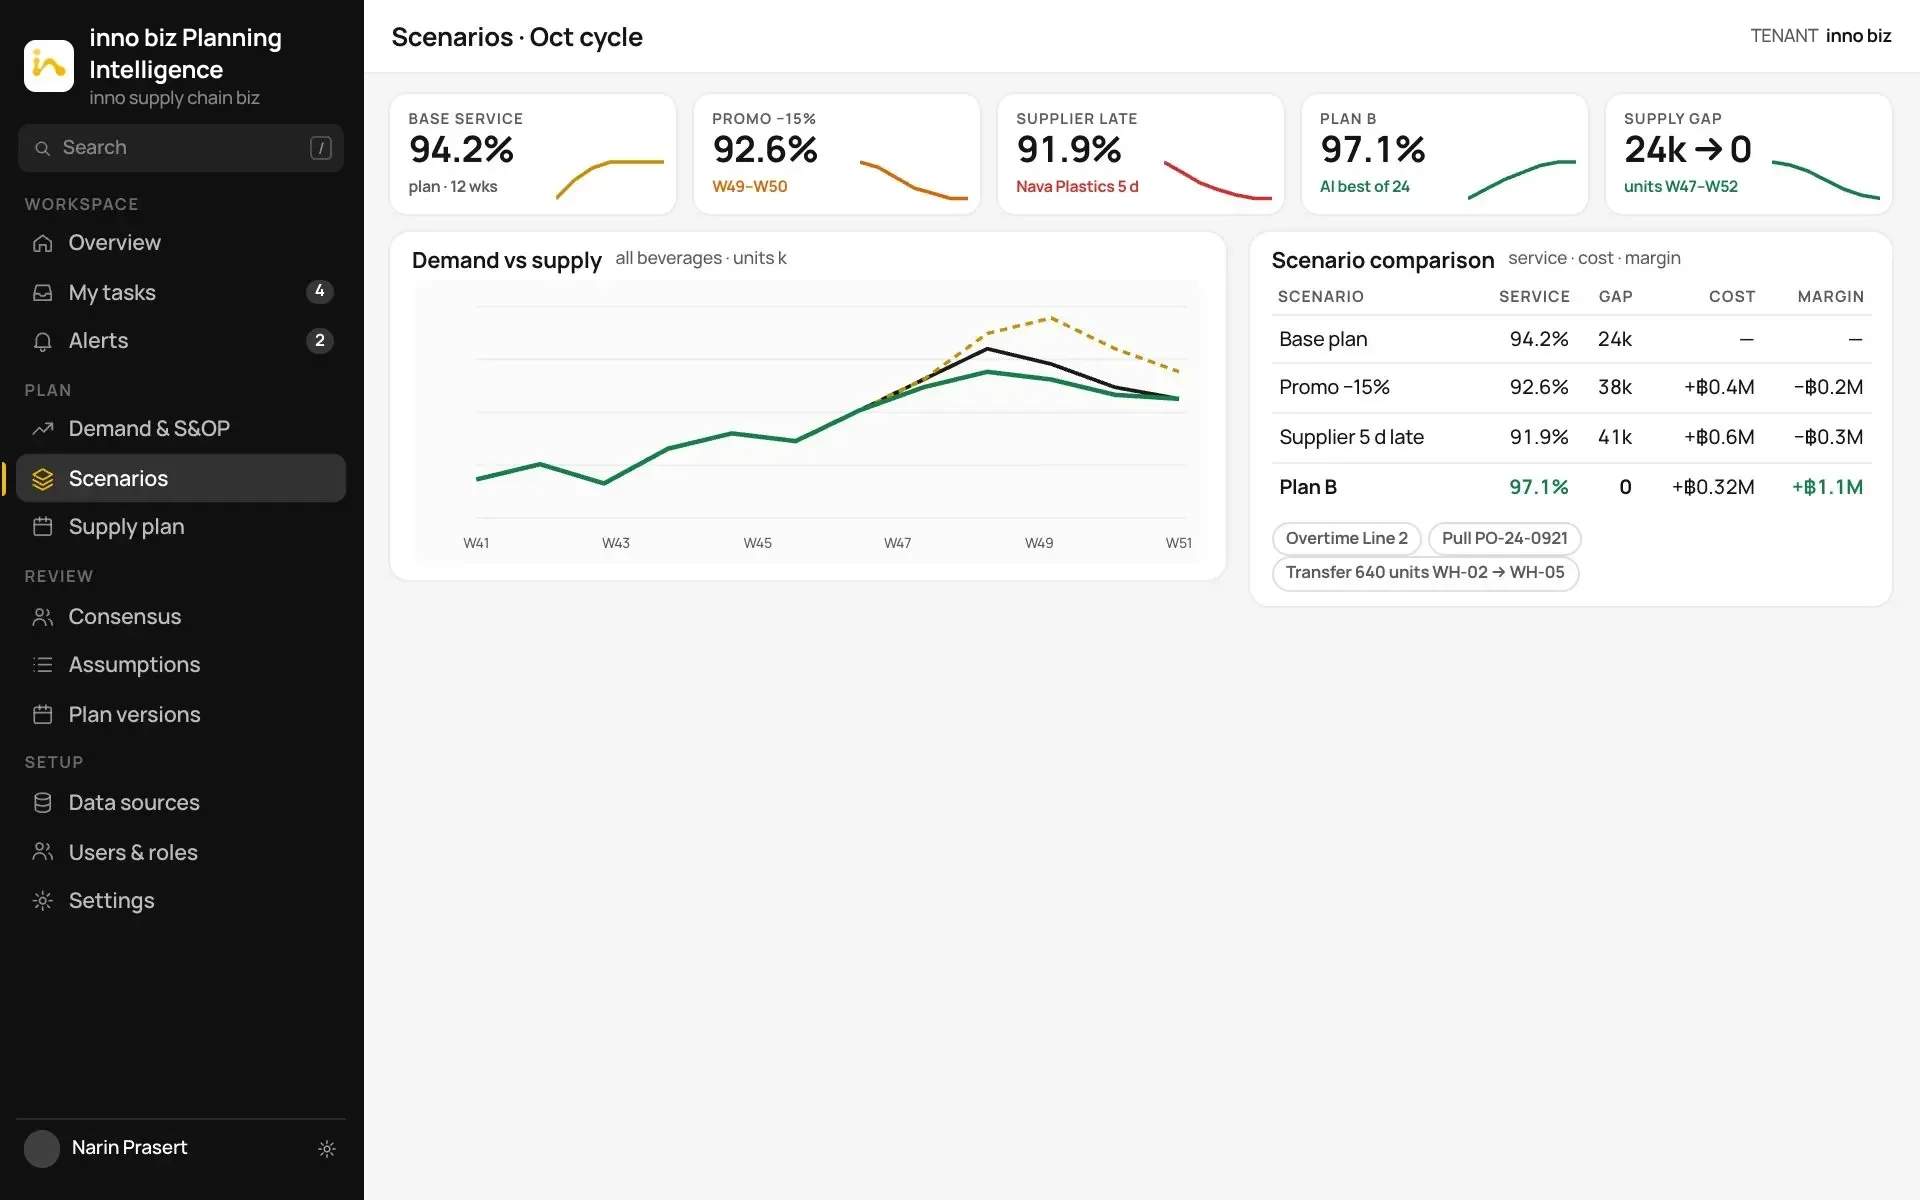
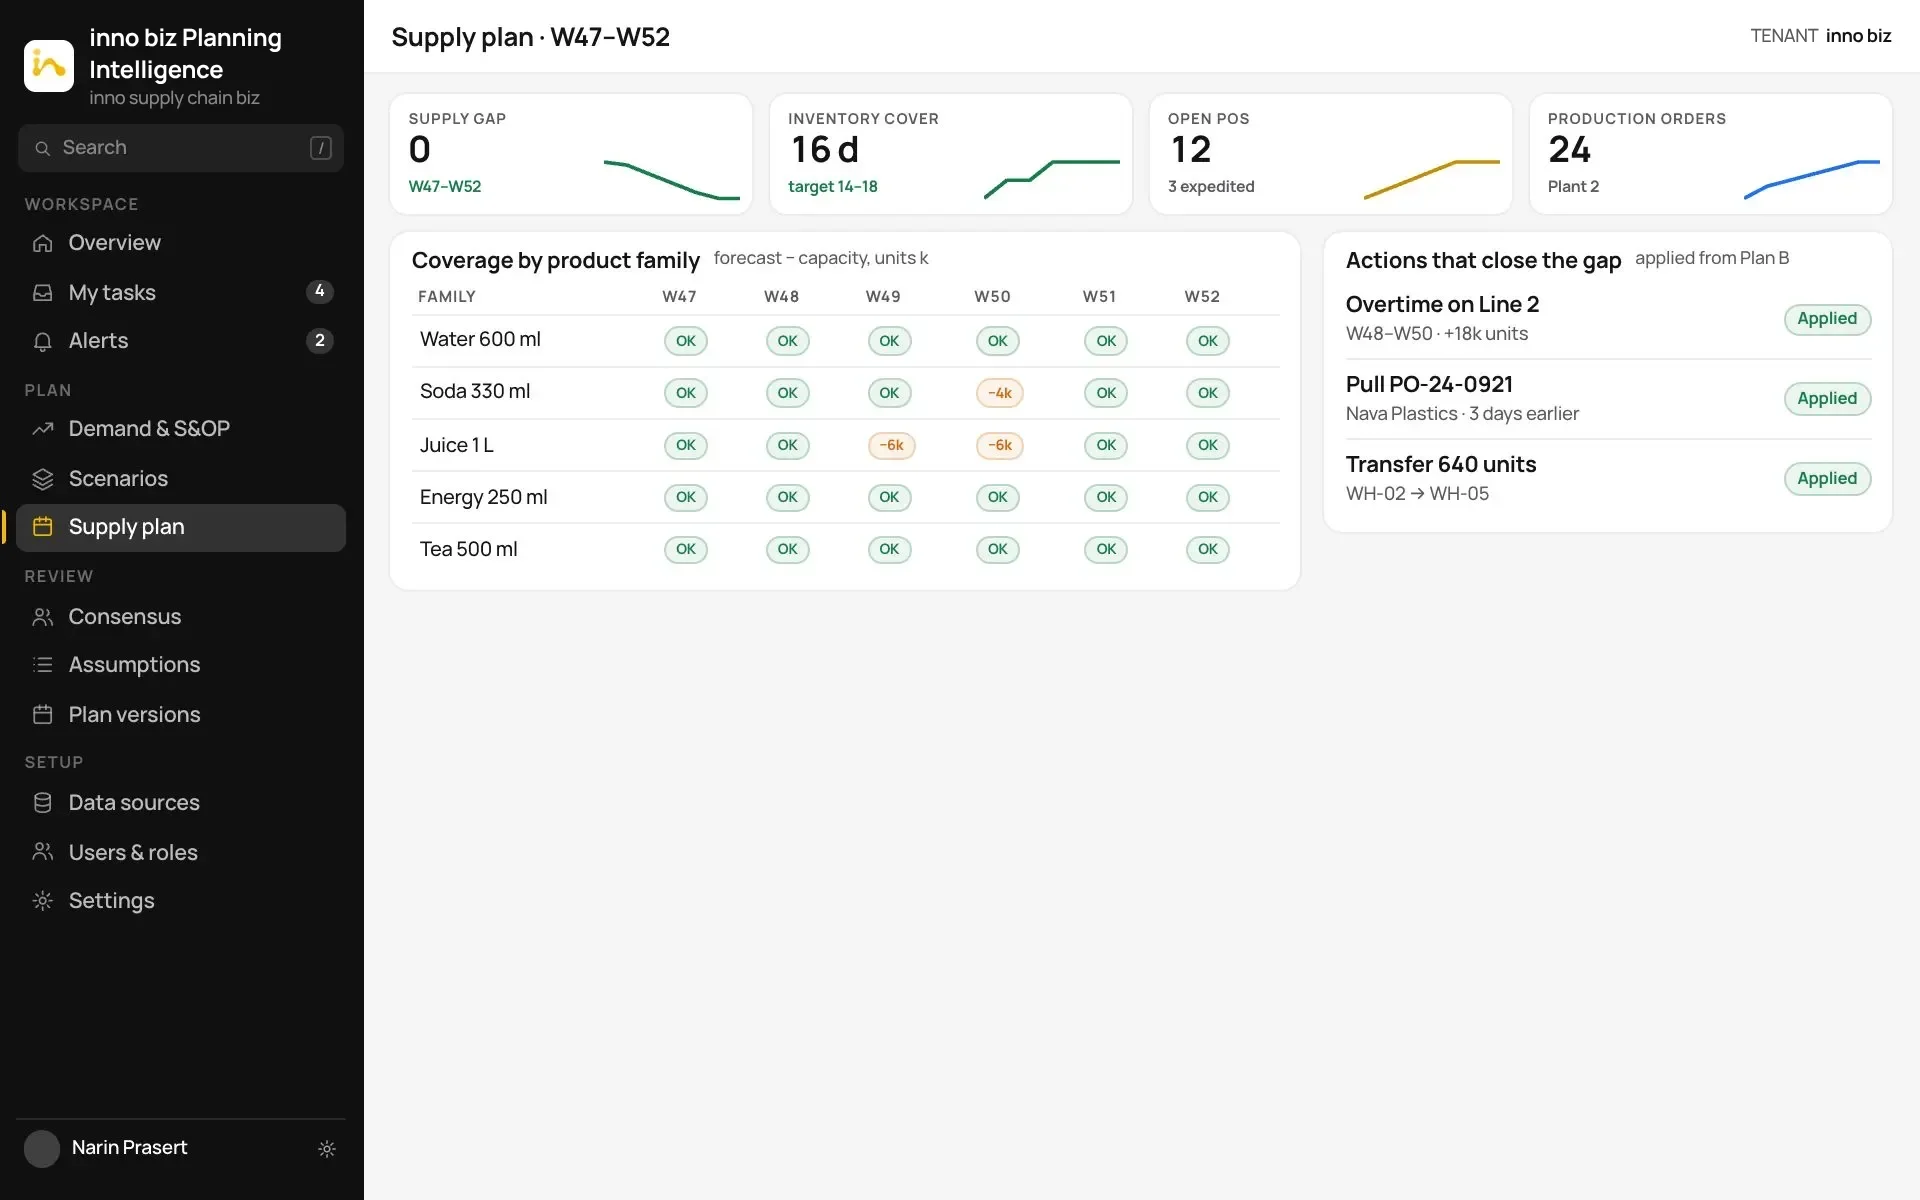
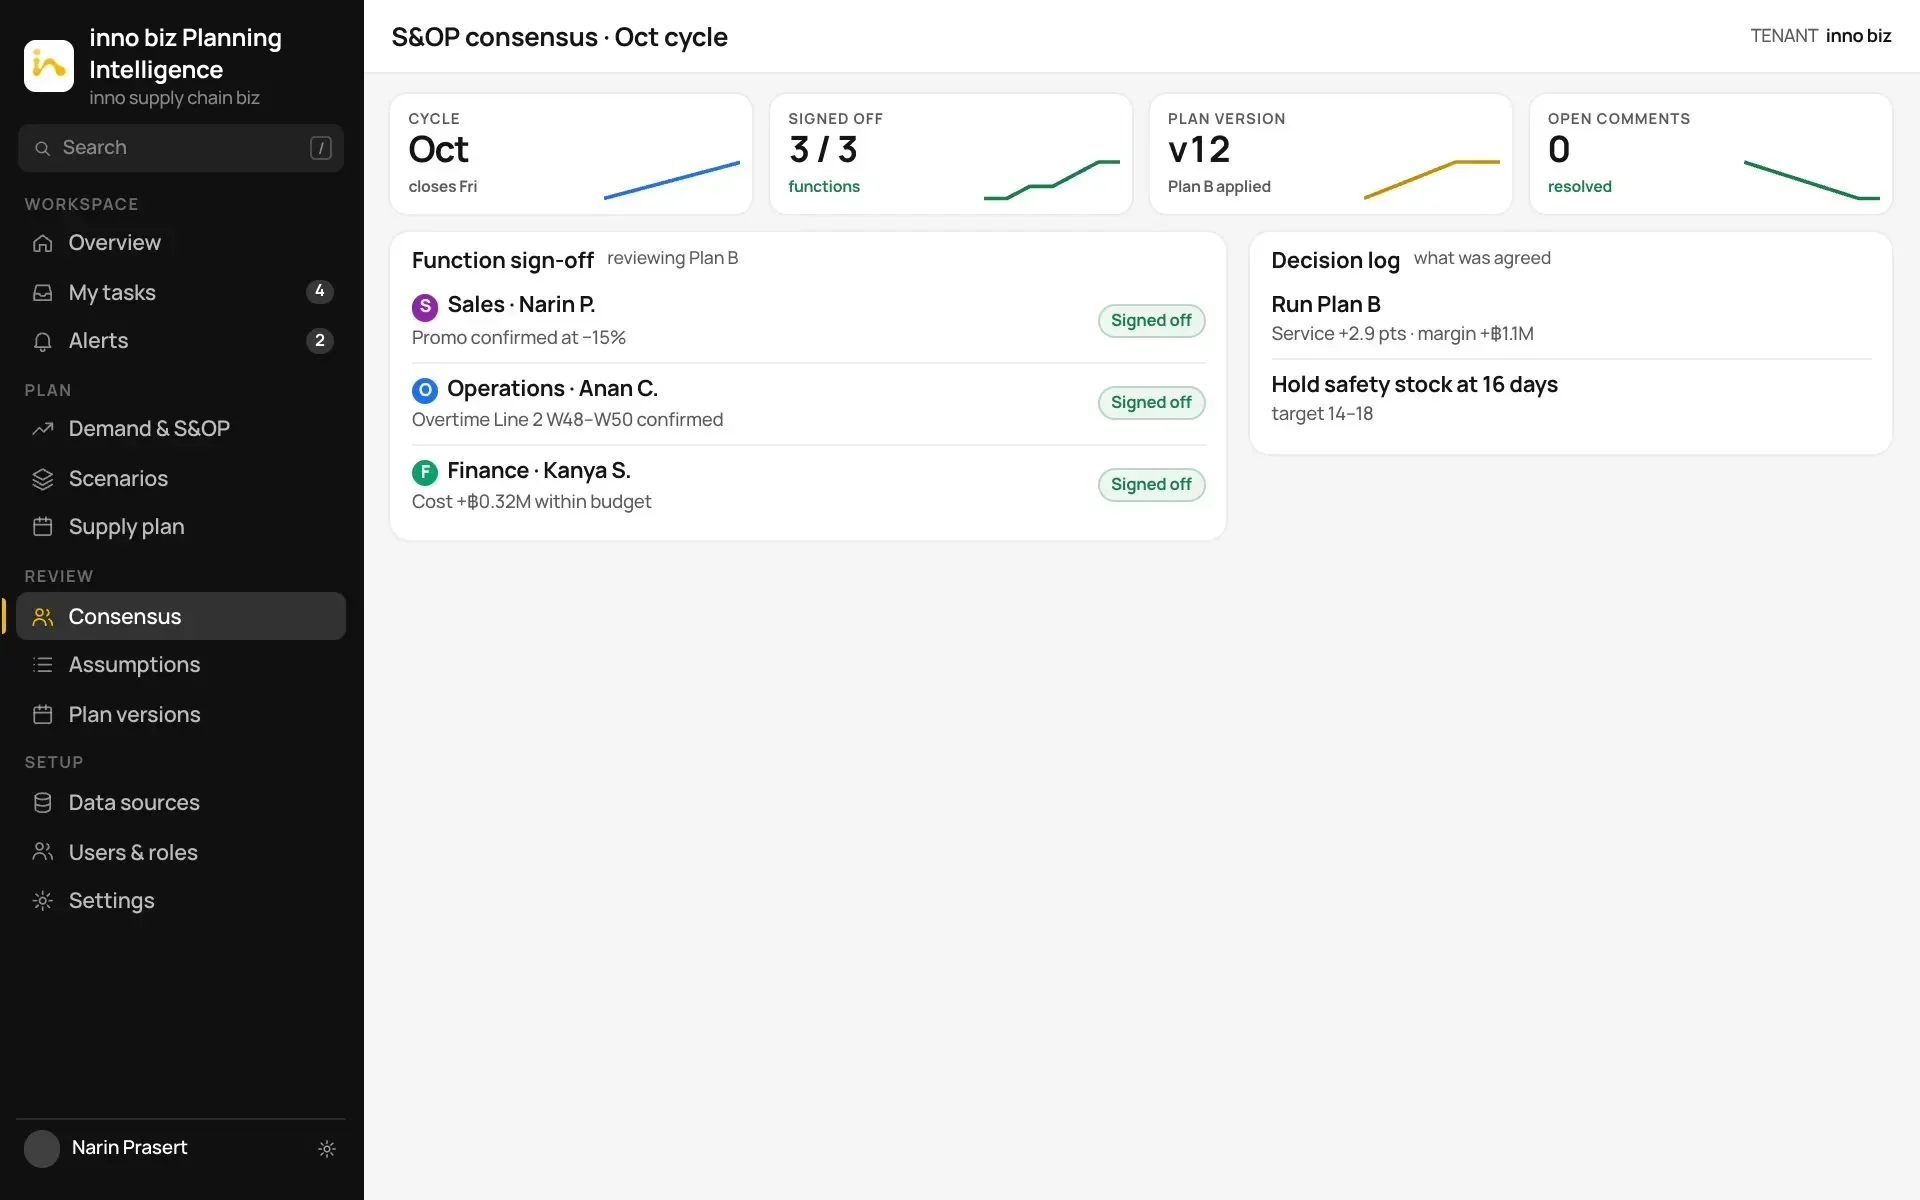
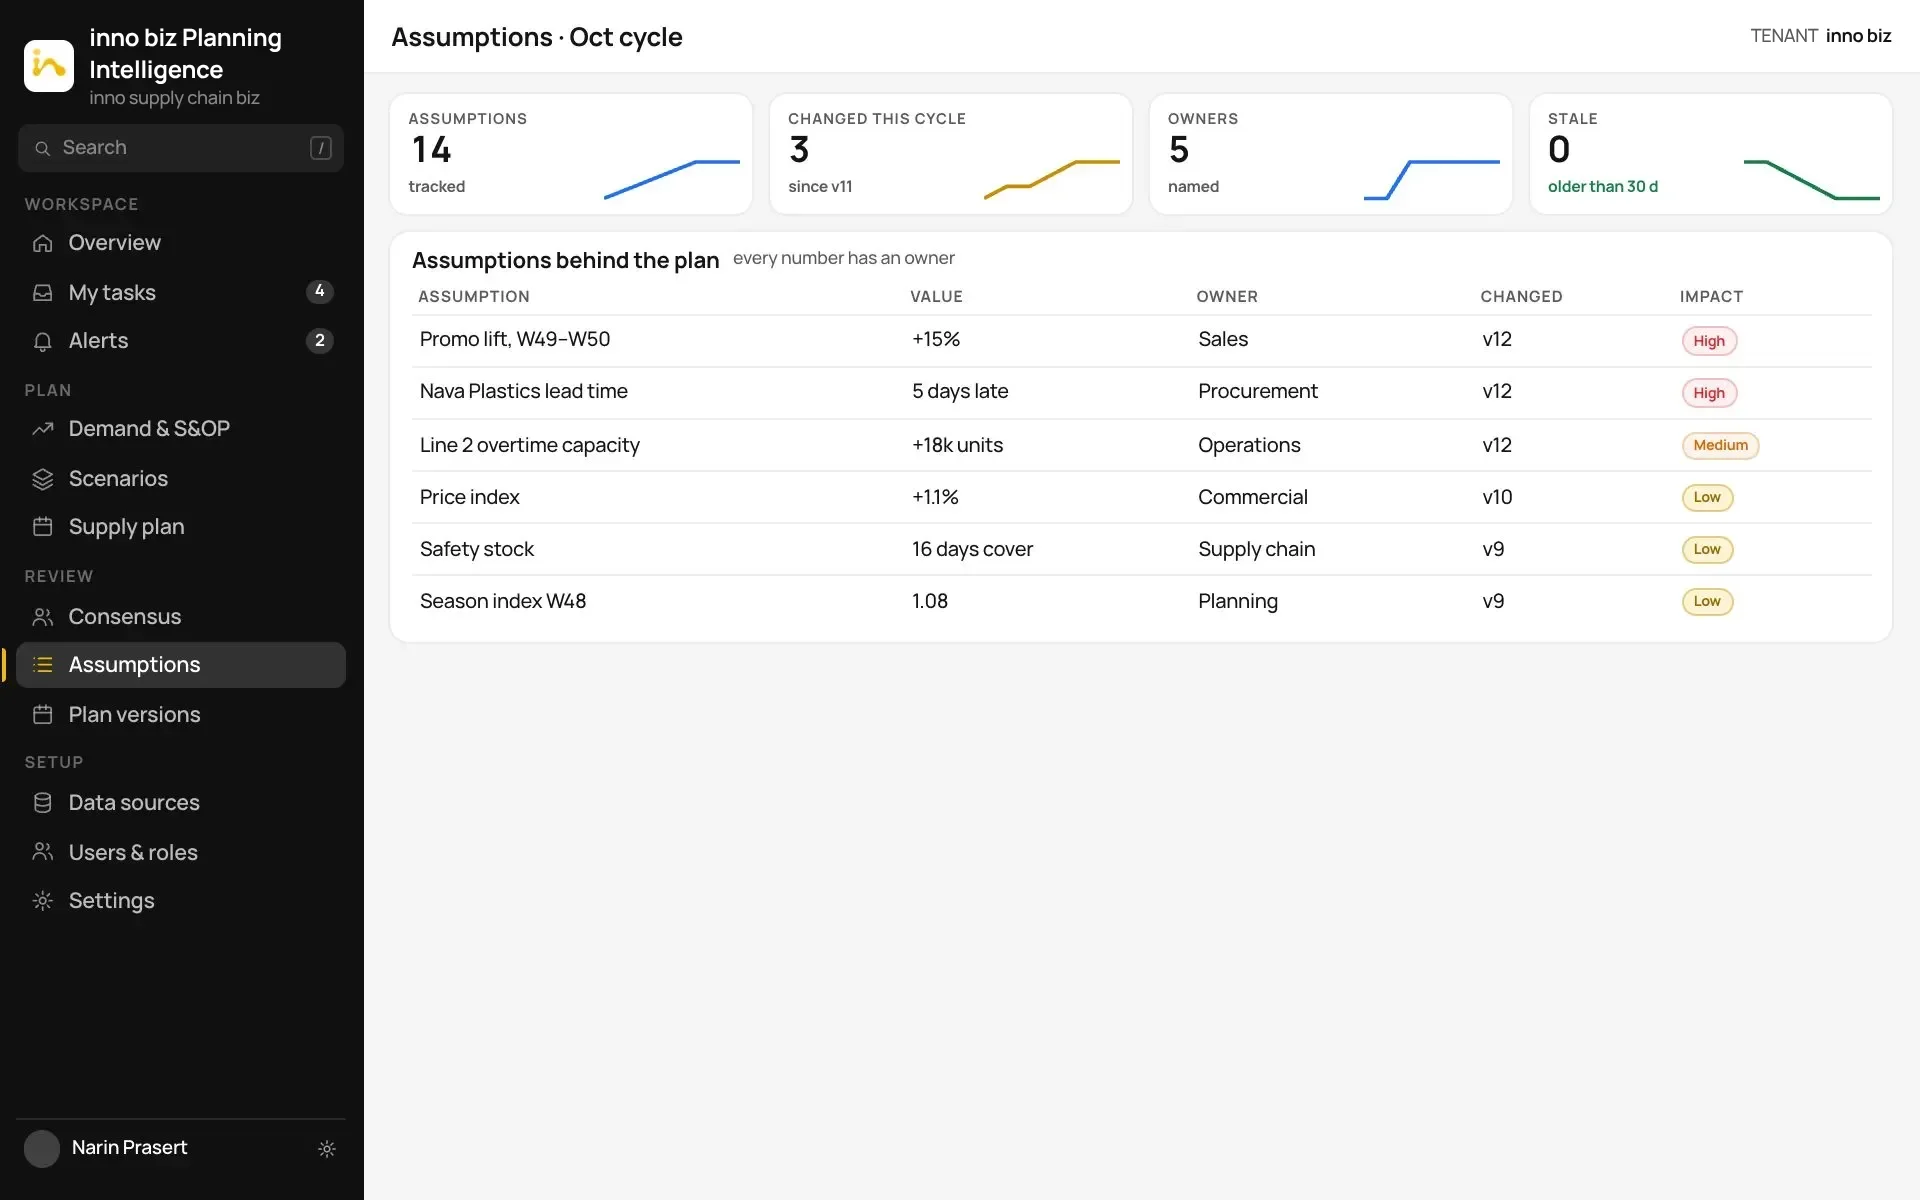
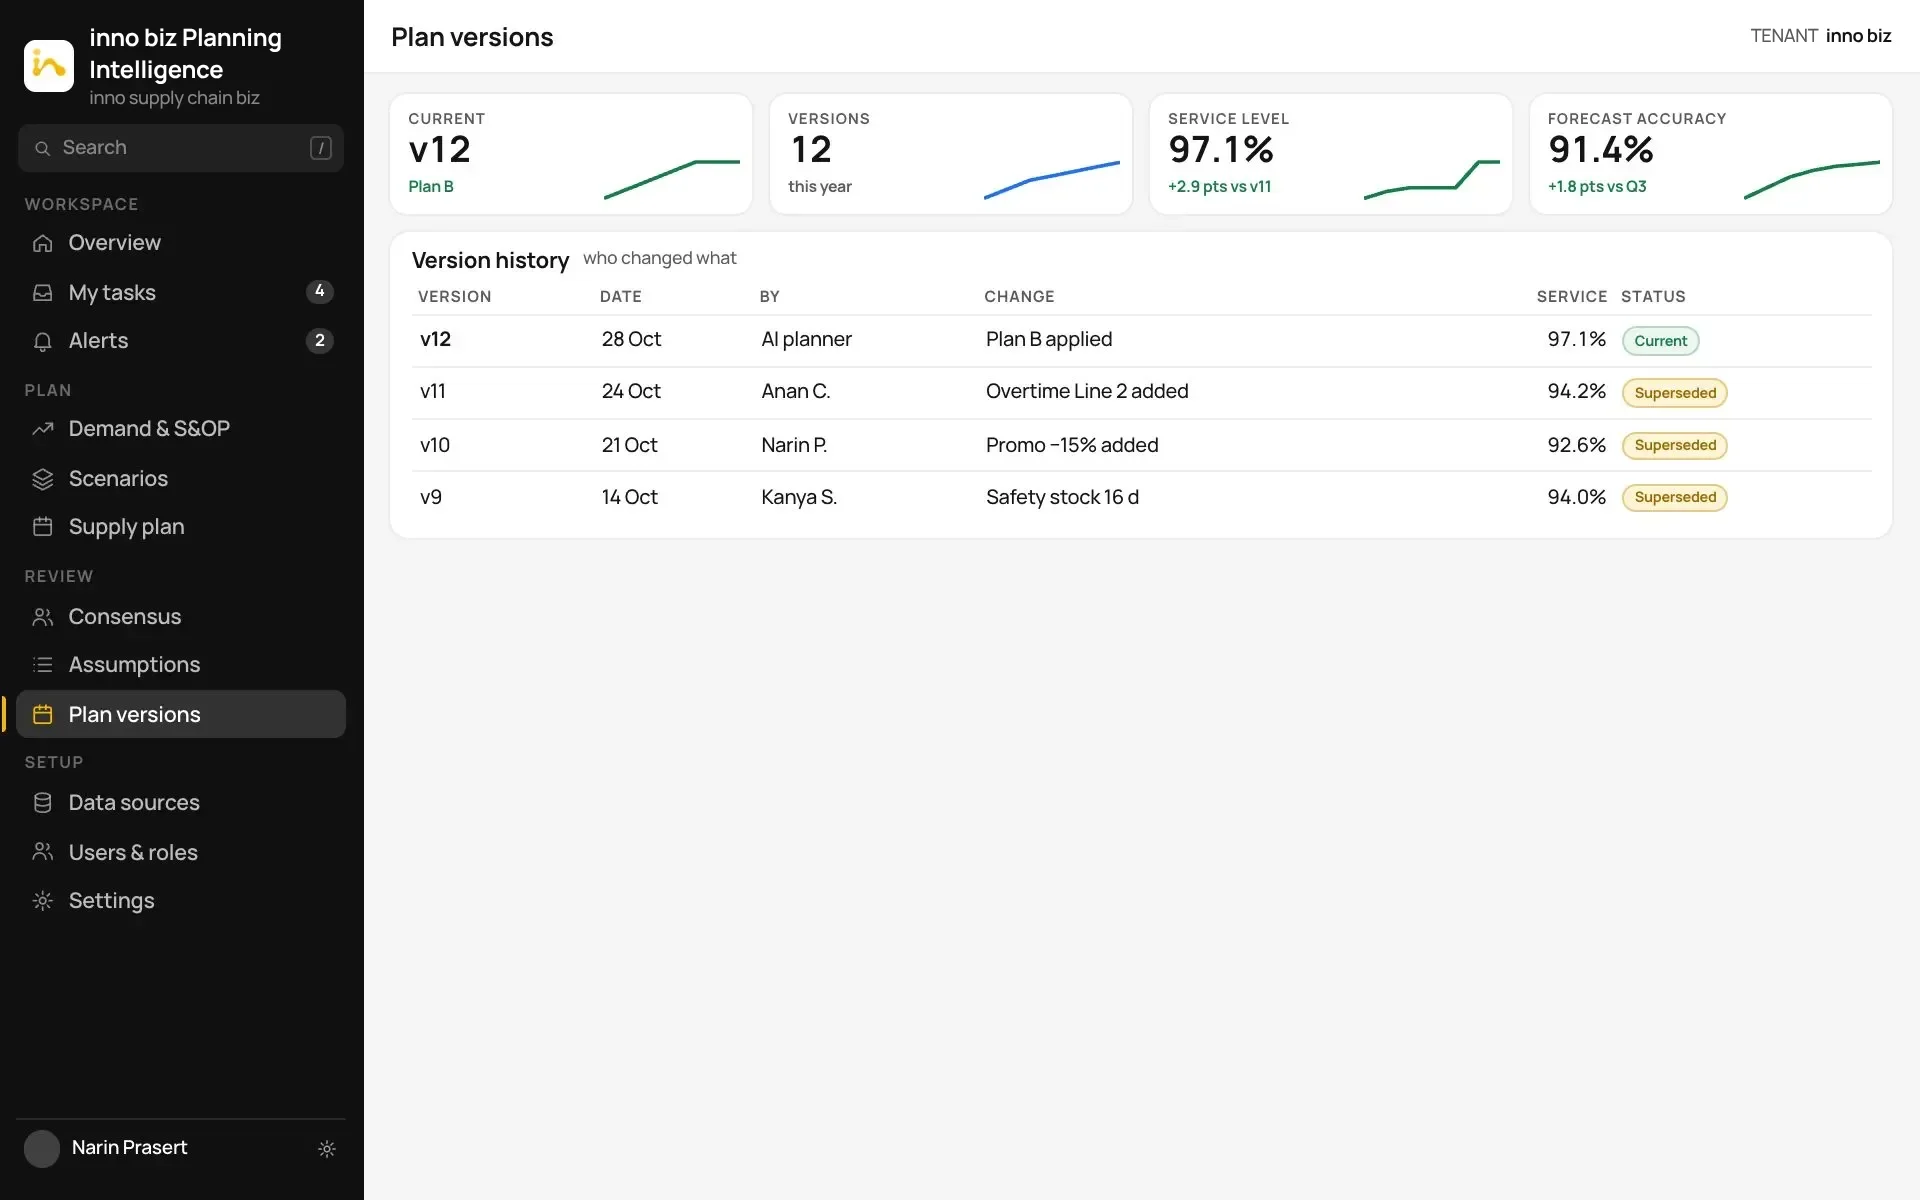
Demand & S&OP. The S&OP control tower: forecast, gap, Plan B and consensus on one screen.Scenarios. Base plan, what-ifs and the AI’s Plan B, compared on service, cost and margin.Supply plan. The supply plan by product family and week, with every gap closed by a named action.Consensus. Sales, Operations and Finance agree one plan, with each decision logged.Assumptions. Every assumption behind the plan, with its value, owner and impact.Plan versions. Every version of the plan, who changed it, and what it did to service.
Plans, forecasts and figures on these screens are sample data to show the idea.