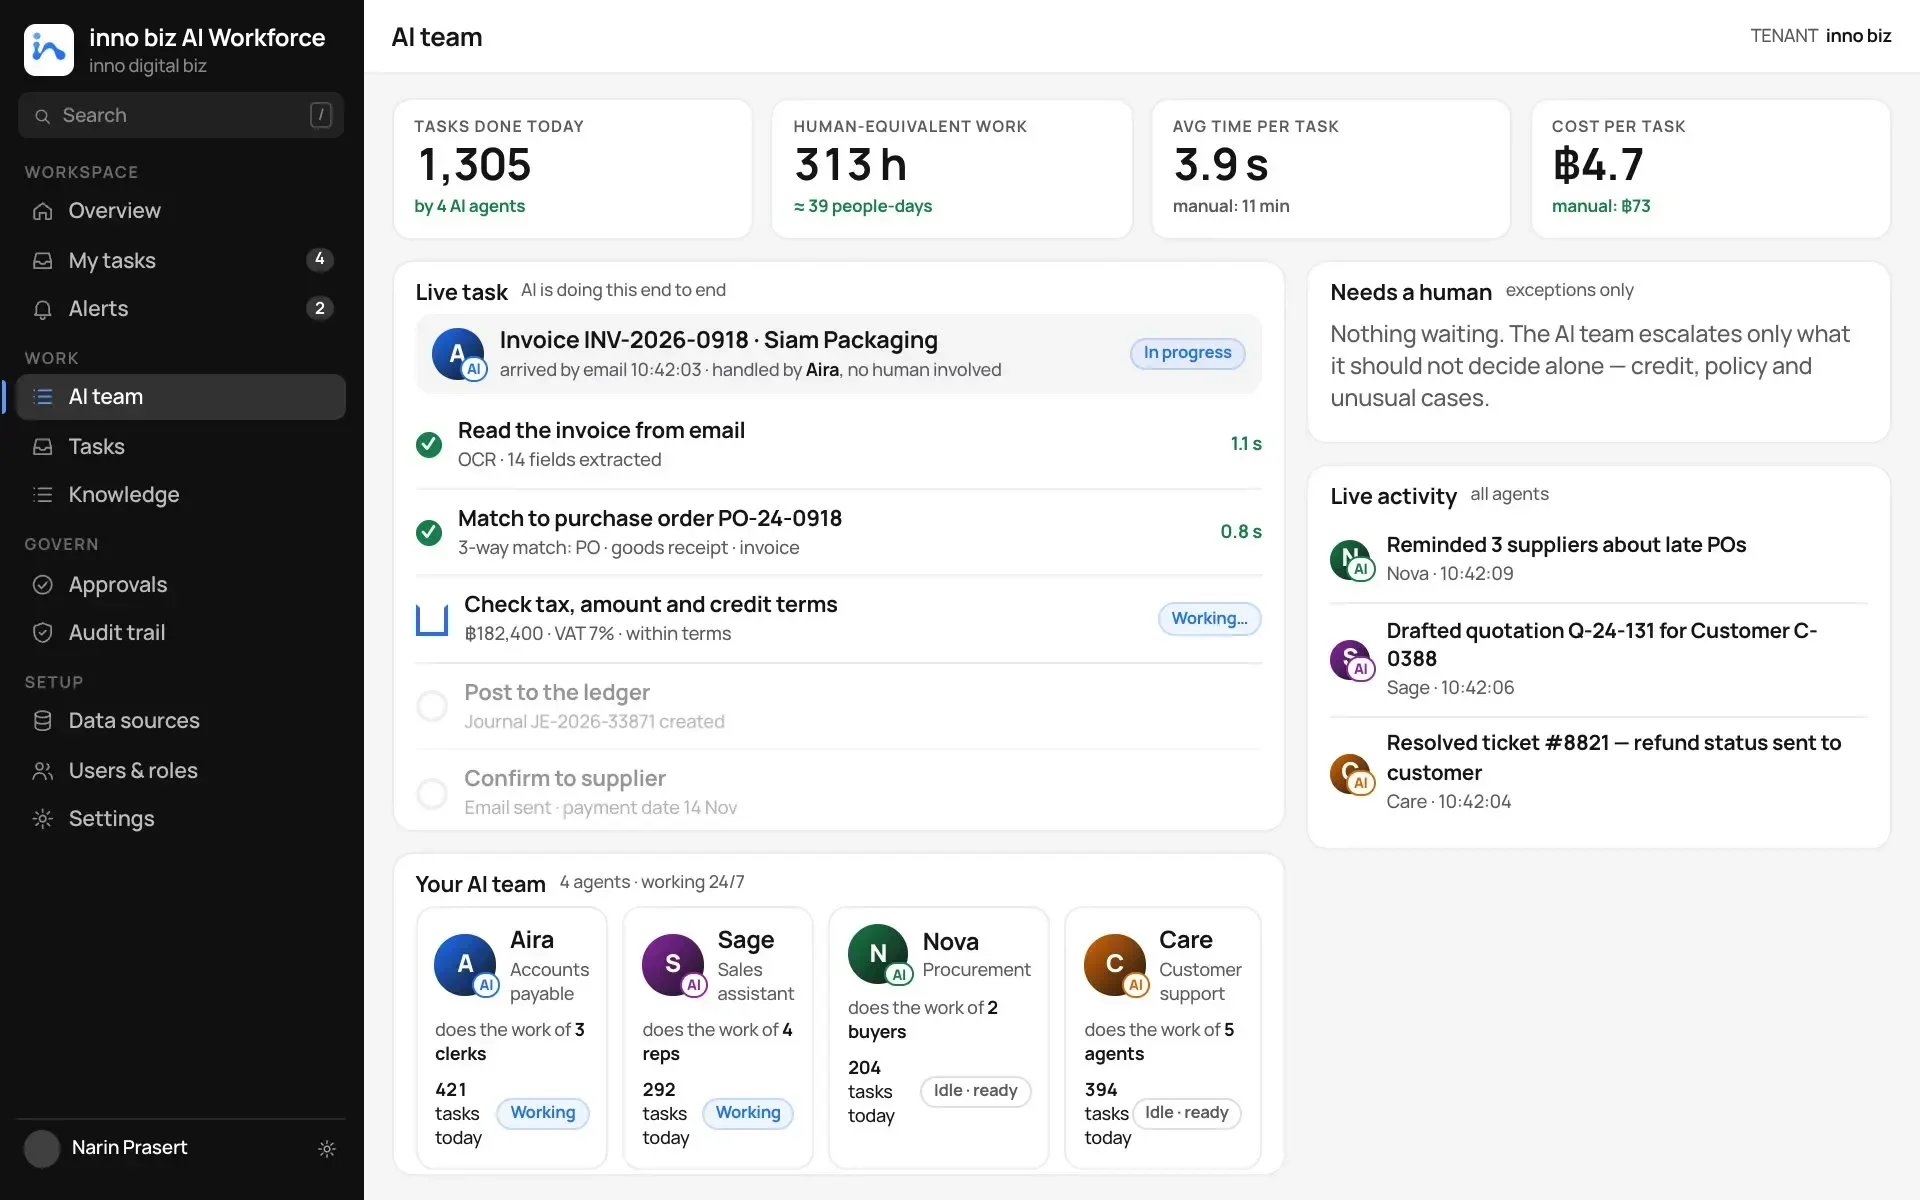
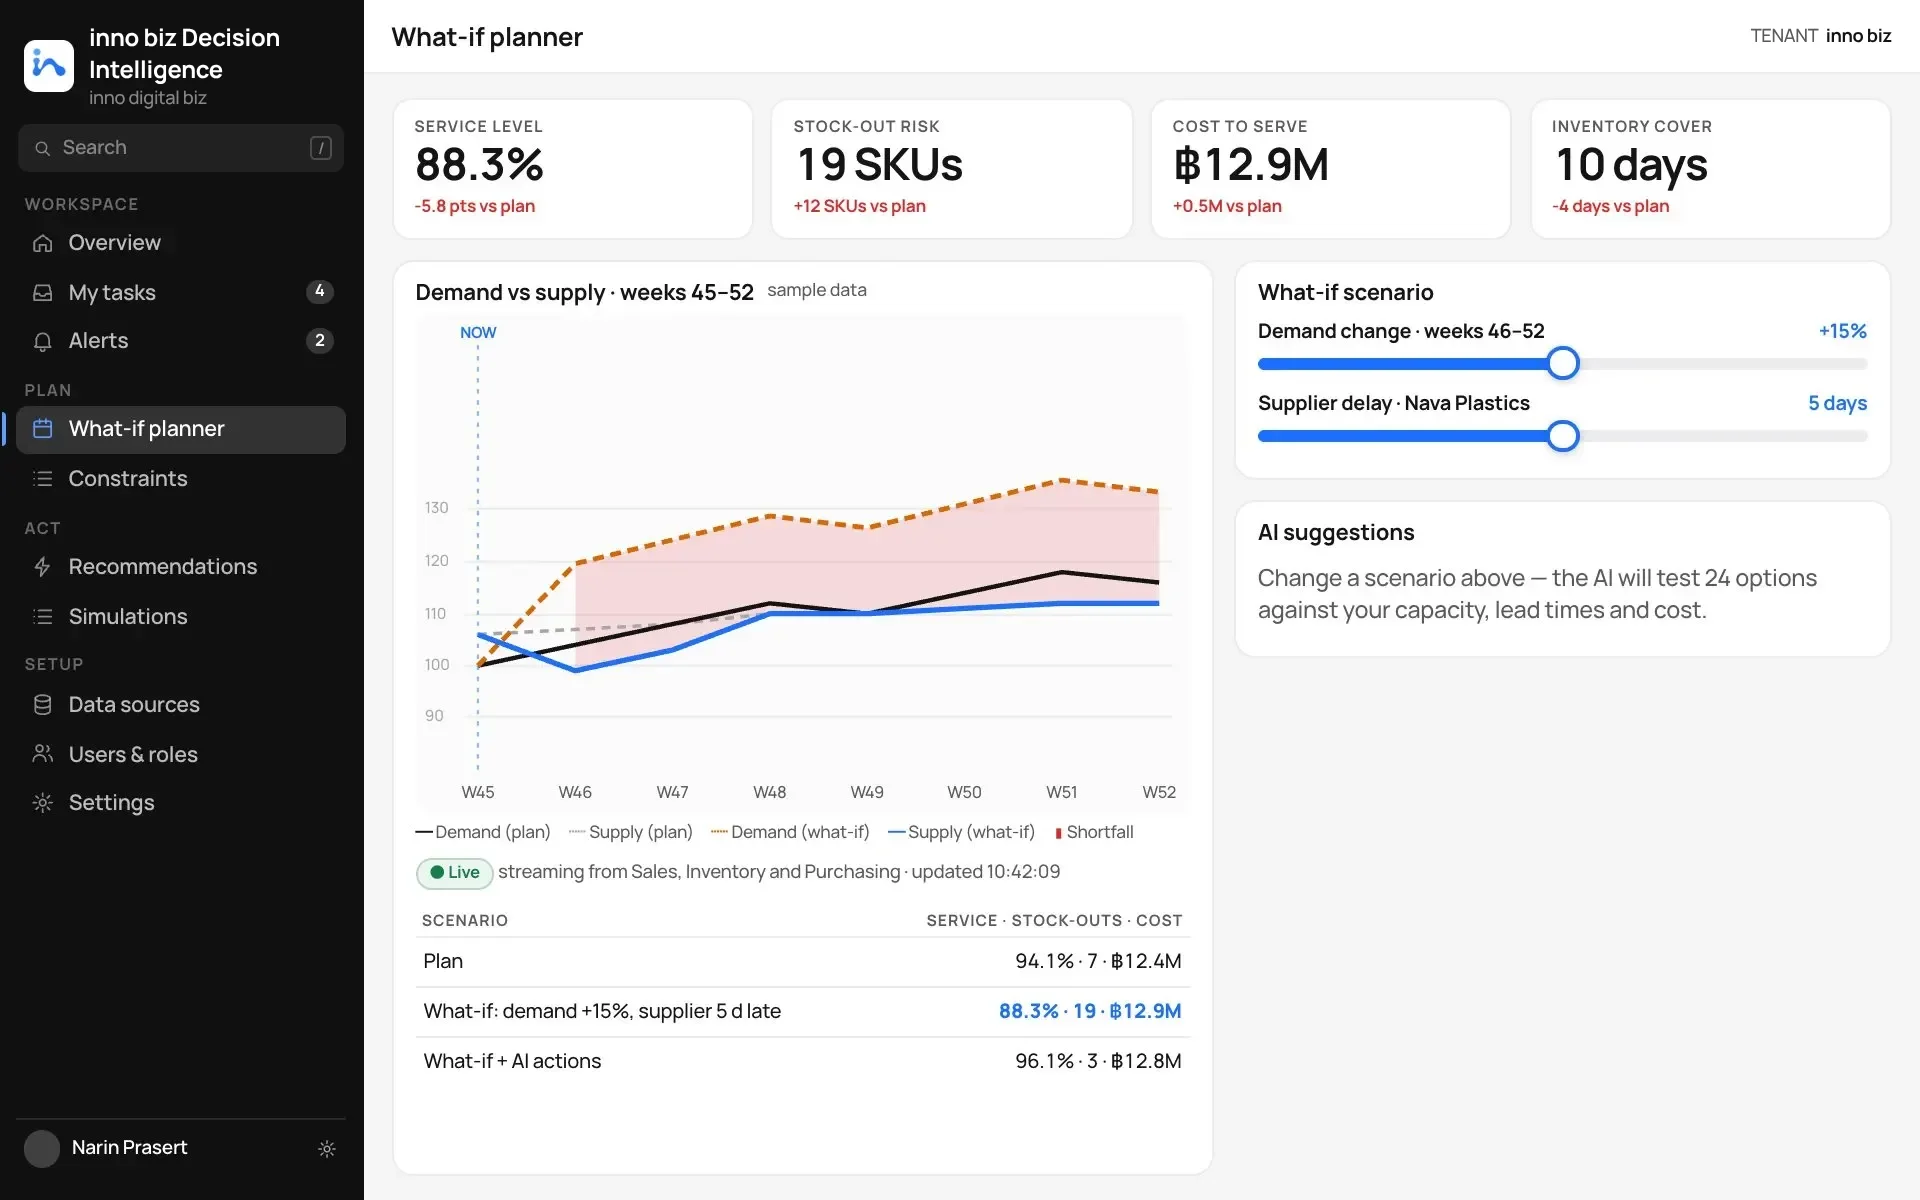
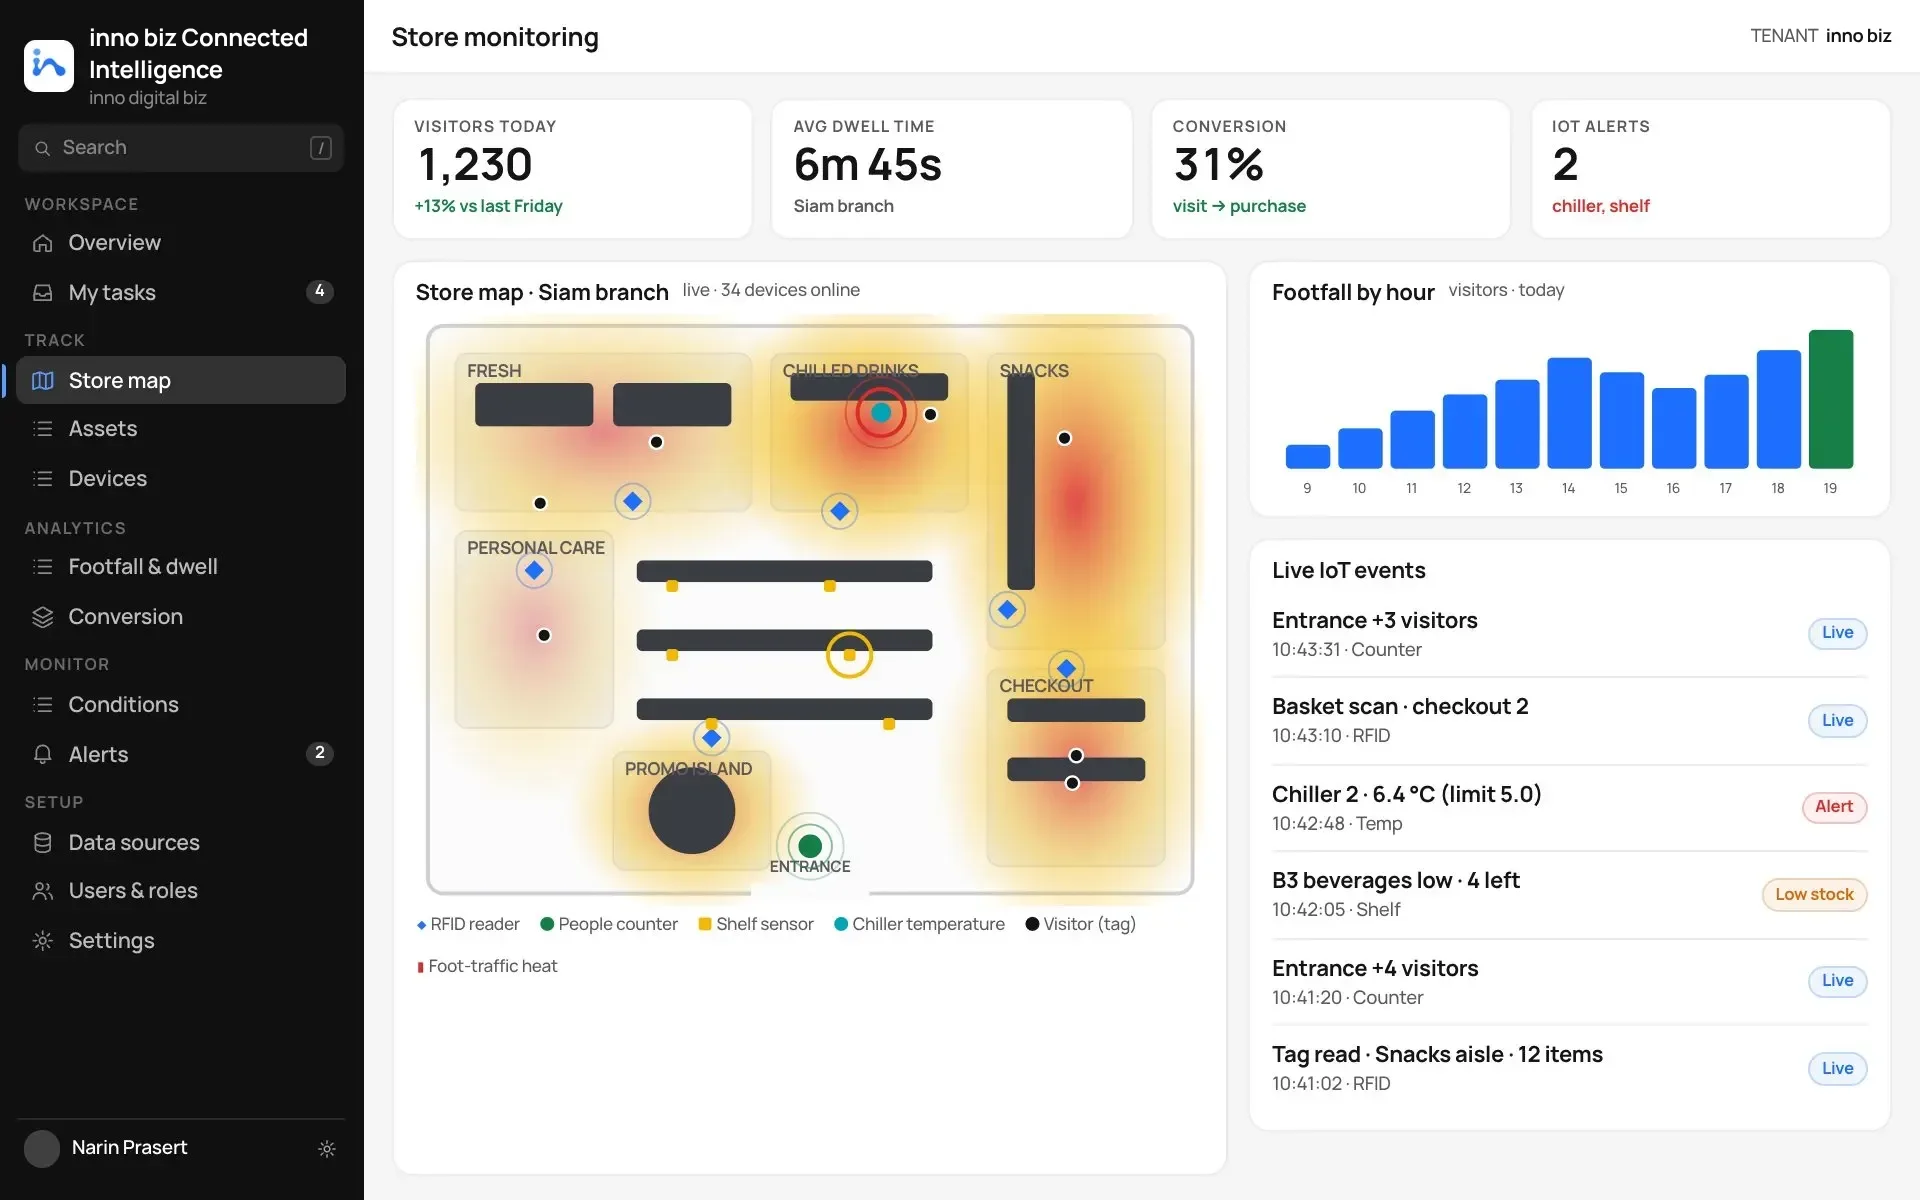
Vision · Image · OCR
Turn what you see into data.
Turn images, video and documents into structured business information — making previously manual observations searchable, measurable and actionable.
Turn images, video and documents into structured business information — making previously manual observations searchable, measurable and actionable.
Each camera is scanned in turn; objects are boxed with a confidence score, and the counters climb as the frames come in.
People, trucks, buses and cars are tallied across all cameras, with the latest detections and the confidence of each one listed.
A single camera view shows what is in the frame, the most confident detections, their size and the inference time — nothing hidden.
Use the menu on the left, or the tabs below — every screen is a page of the product, with sample data.
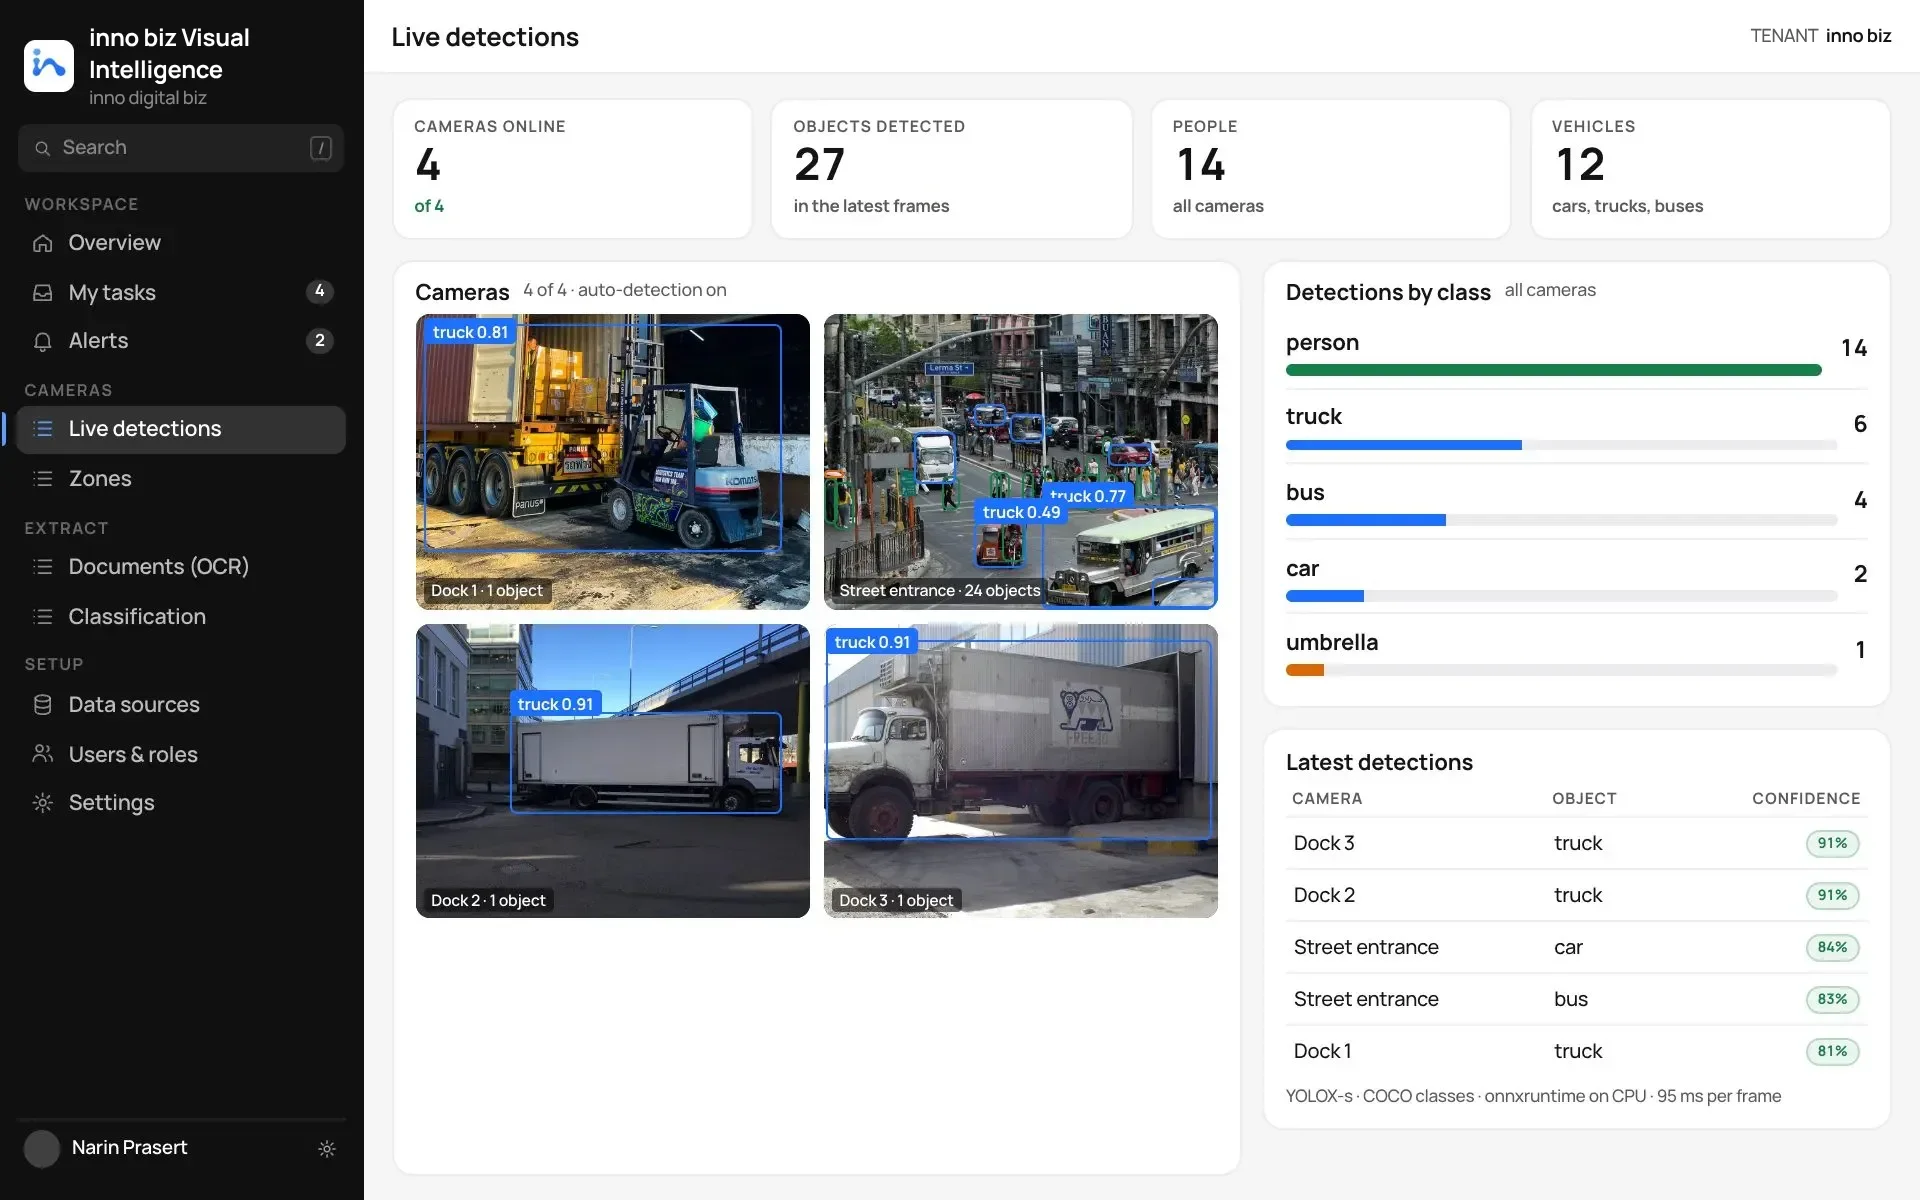
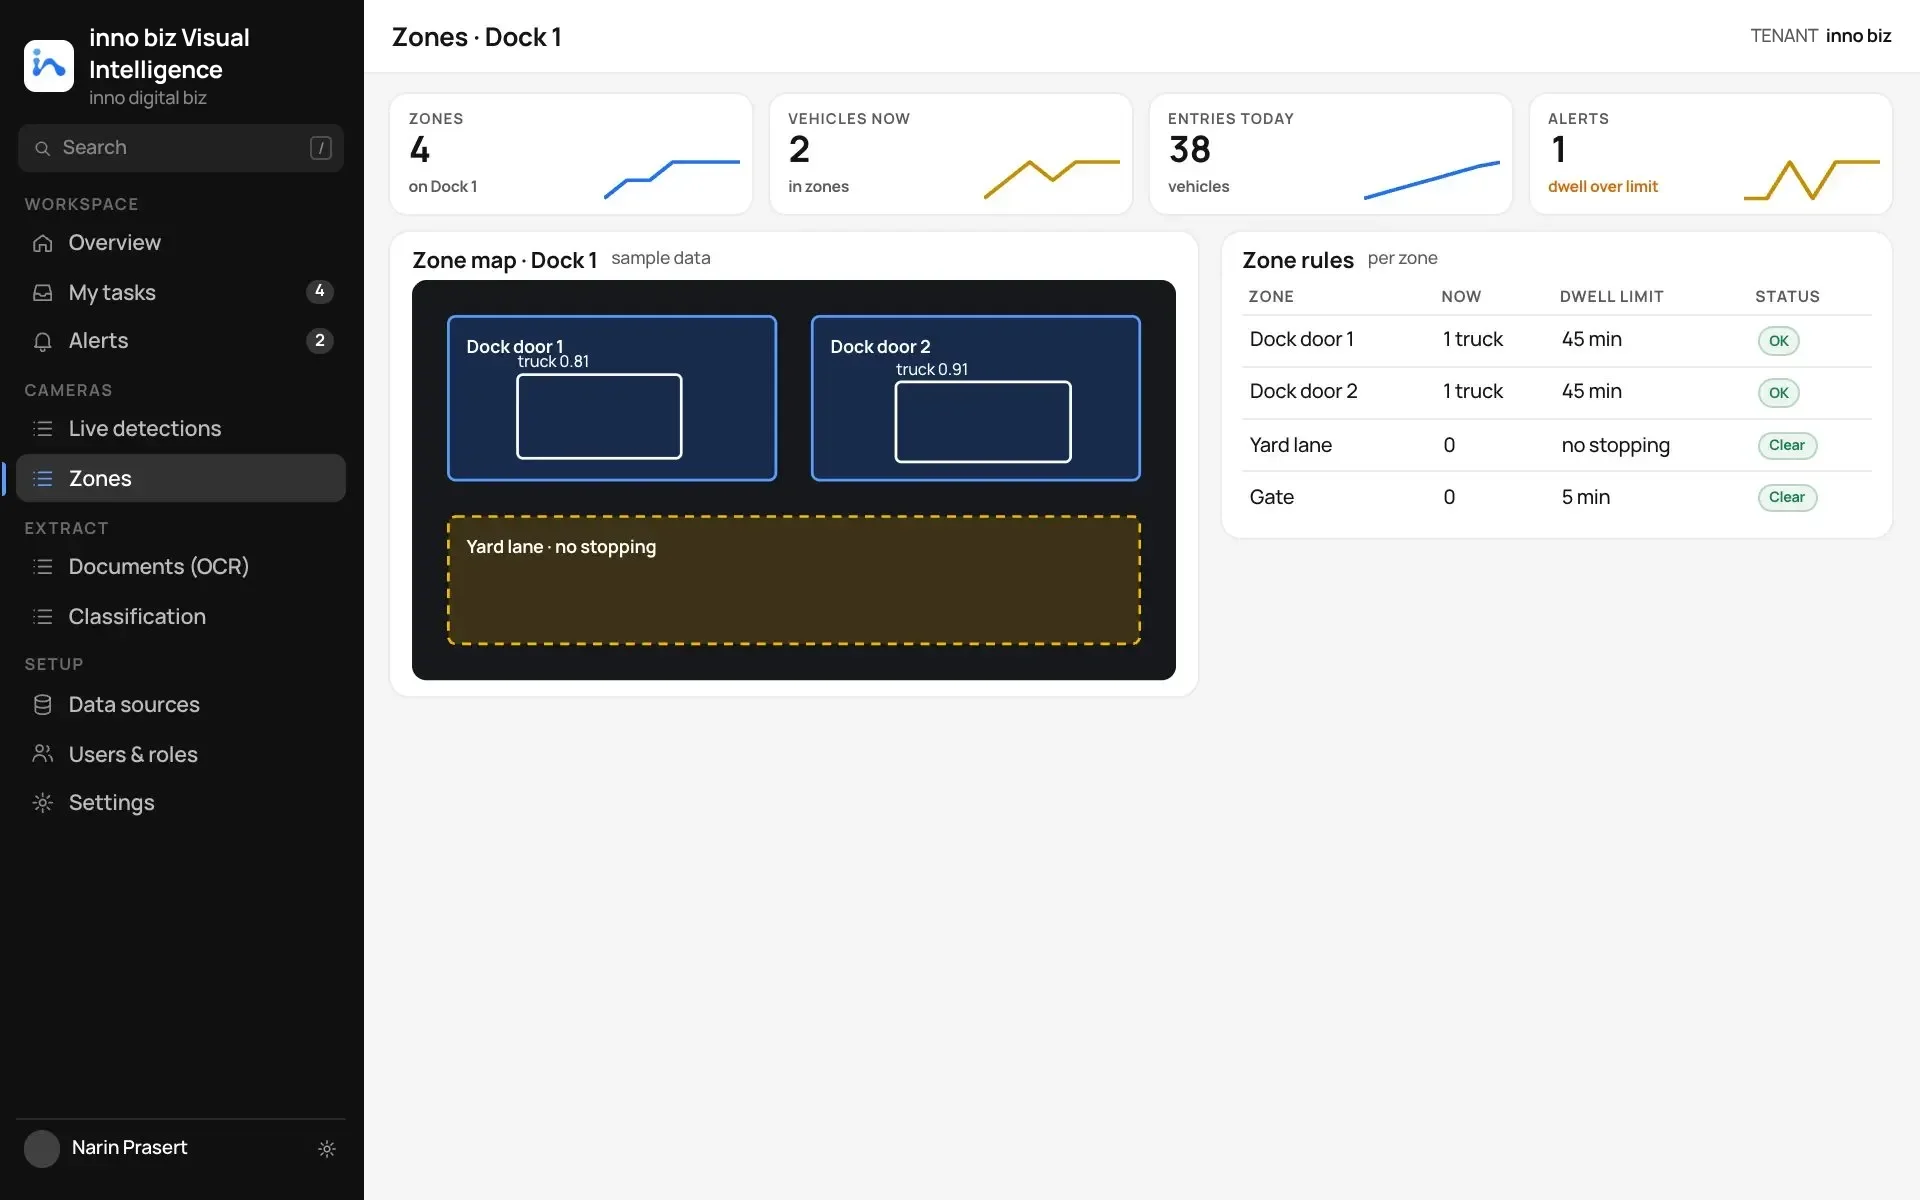
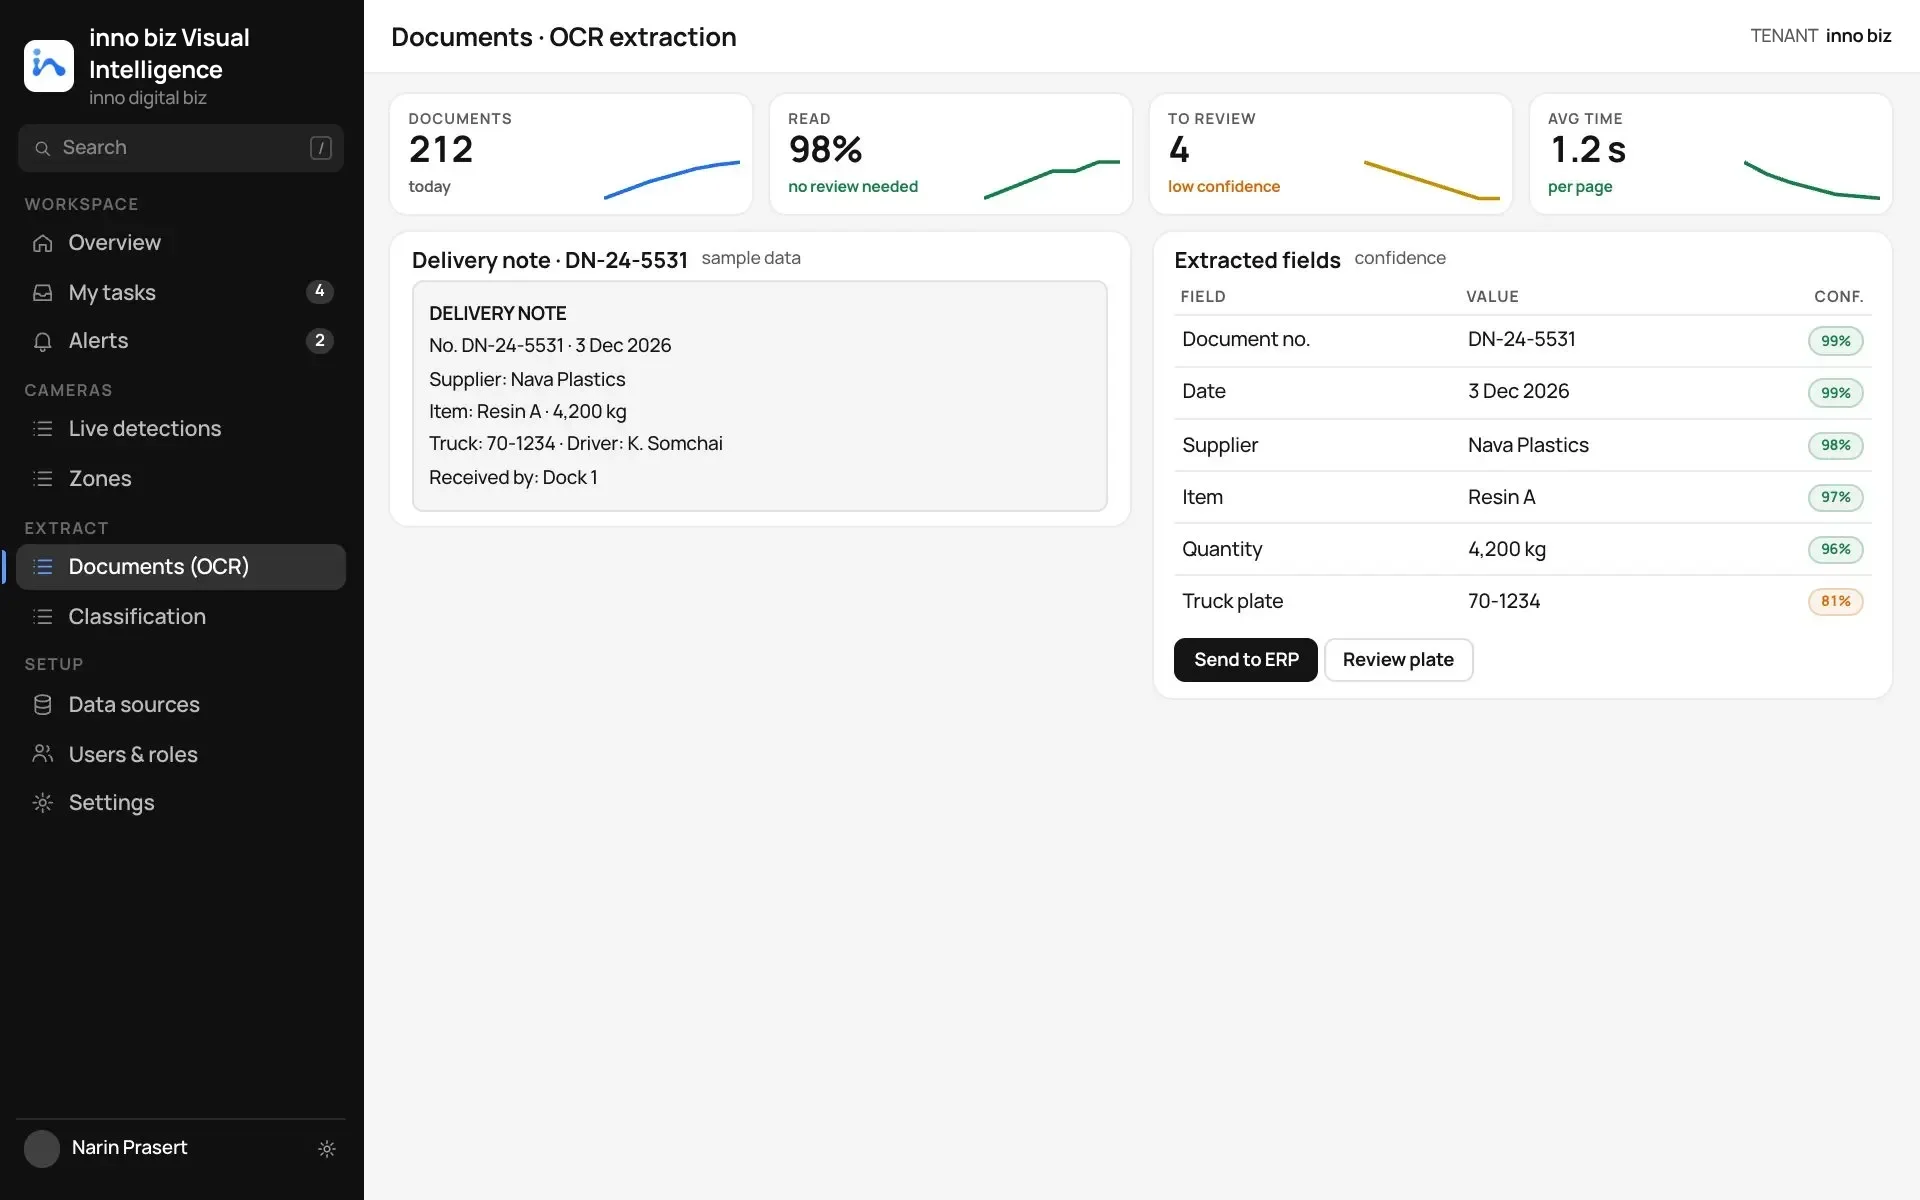
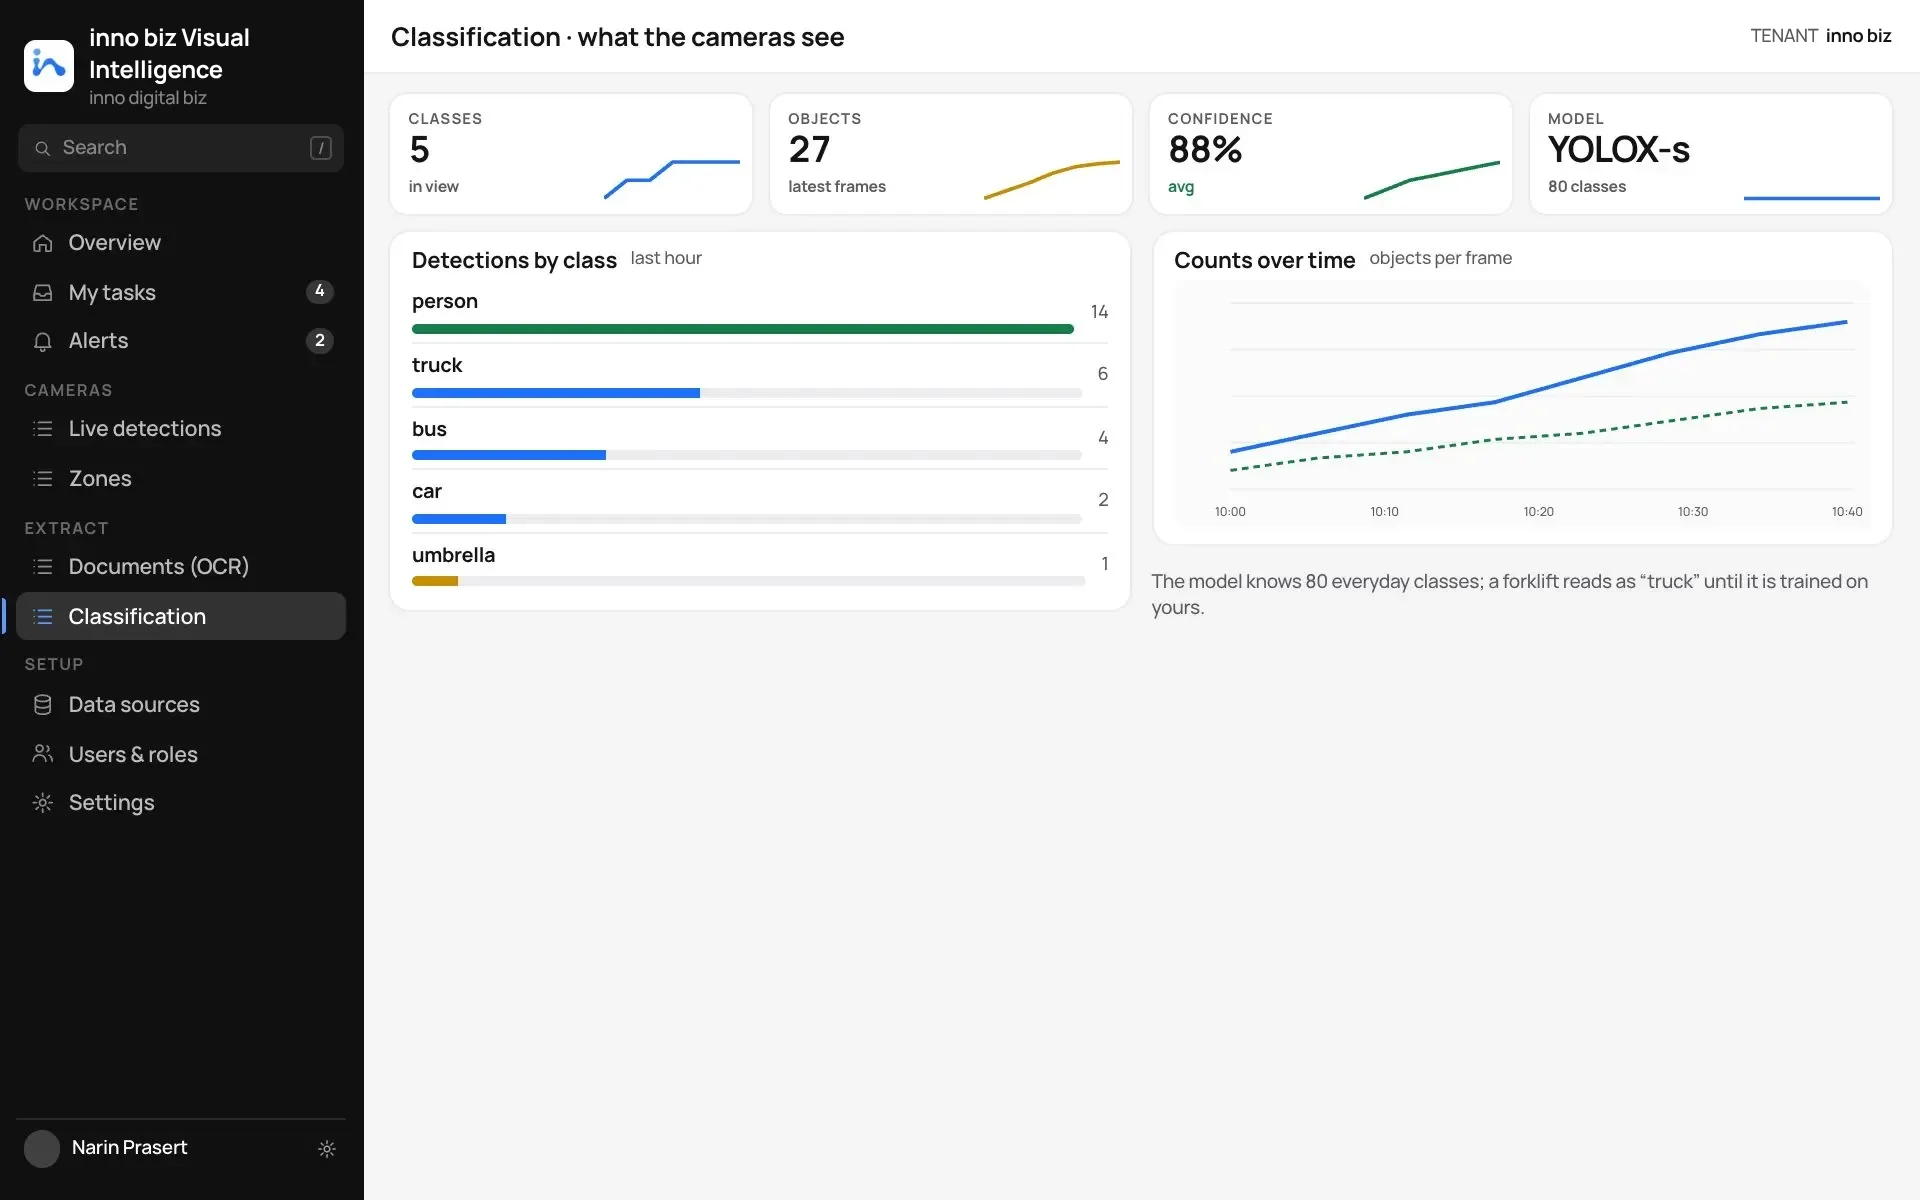
Live detections. Four cameras analyzed live, with a box and confidence per object.Zones. Draw zones on the camera view and count what enters and stays.Documents (OCR). Delivery notes and invoices turned into fields, with a confidence for each.Classification. Everything the cameras recognize, counted by class and over time.
Real photos via Wikimedia Commons: Goterrestrial (CC BY 4.0), PhiliptheNumber1 (CC BY 4.0), Eric Fischer (CC BY 2.0), Sgt. Raul Elliot, U.S. Army (public domain). On the Live detections screen the boxes are the live output of YOLOX-s (Apache-2.0) running on a laptop CPU; the model knows 80 everyday classes, so a forklift reads as “truck” until it is trained on yours. The Zones, Documents (OCR) and Classification screens in the tour are illustrations with sample data, not model output.