Reporting · Insight · Board pack
Numbers that explain themselves.
Management reports your team can read in minutes — by branch, product, customer or project — with the variance explained in plain language.
Management reports your team can read in minutes — by branch, product, customer or project — with the variance explained in plain language.
The year’s revenue curve sits against budget, with every branch’s variance underneath — one branch at −8.0% stands out immediately.
Select the branch and drill into product lines; the AI explains the variance — two key accounts moved orders to next month, margin held, so the gap is timing, not price.
Twelve pages assembled from the ledger and sent to the CFO, on the same screen as the numbers.
Use the menu on the left, or the tabs below — every screen is a page of the product, with sample data.
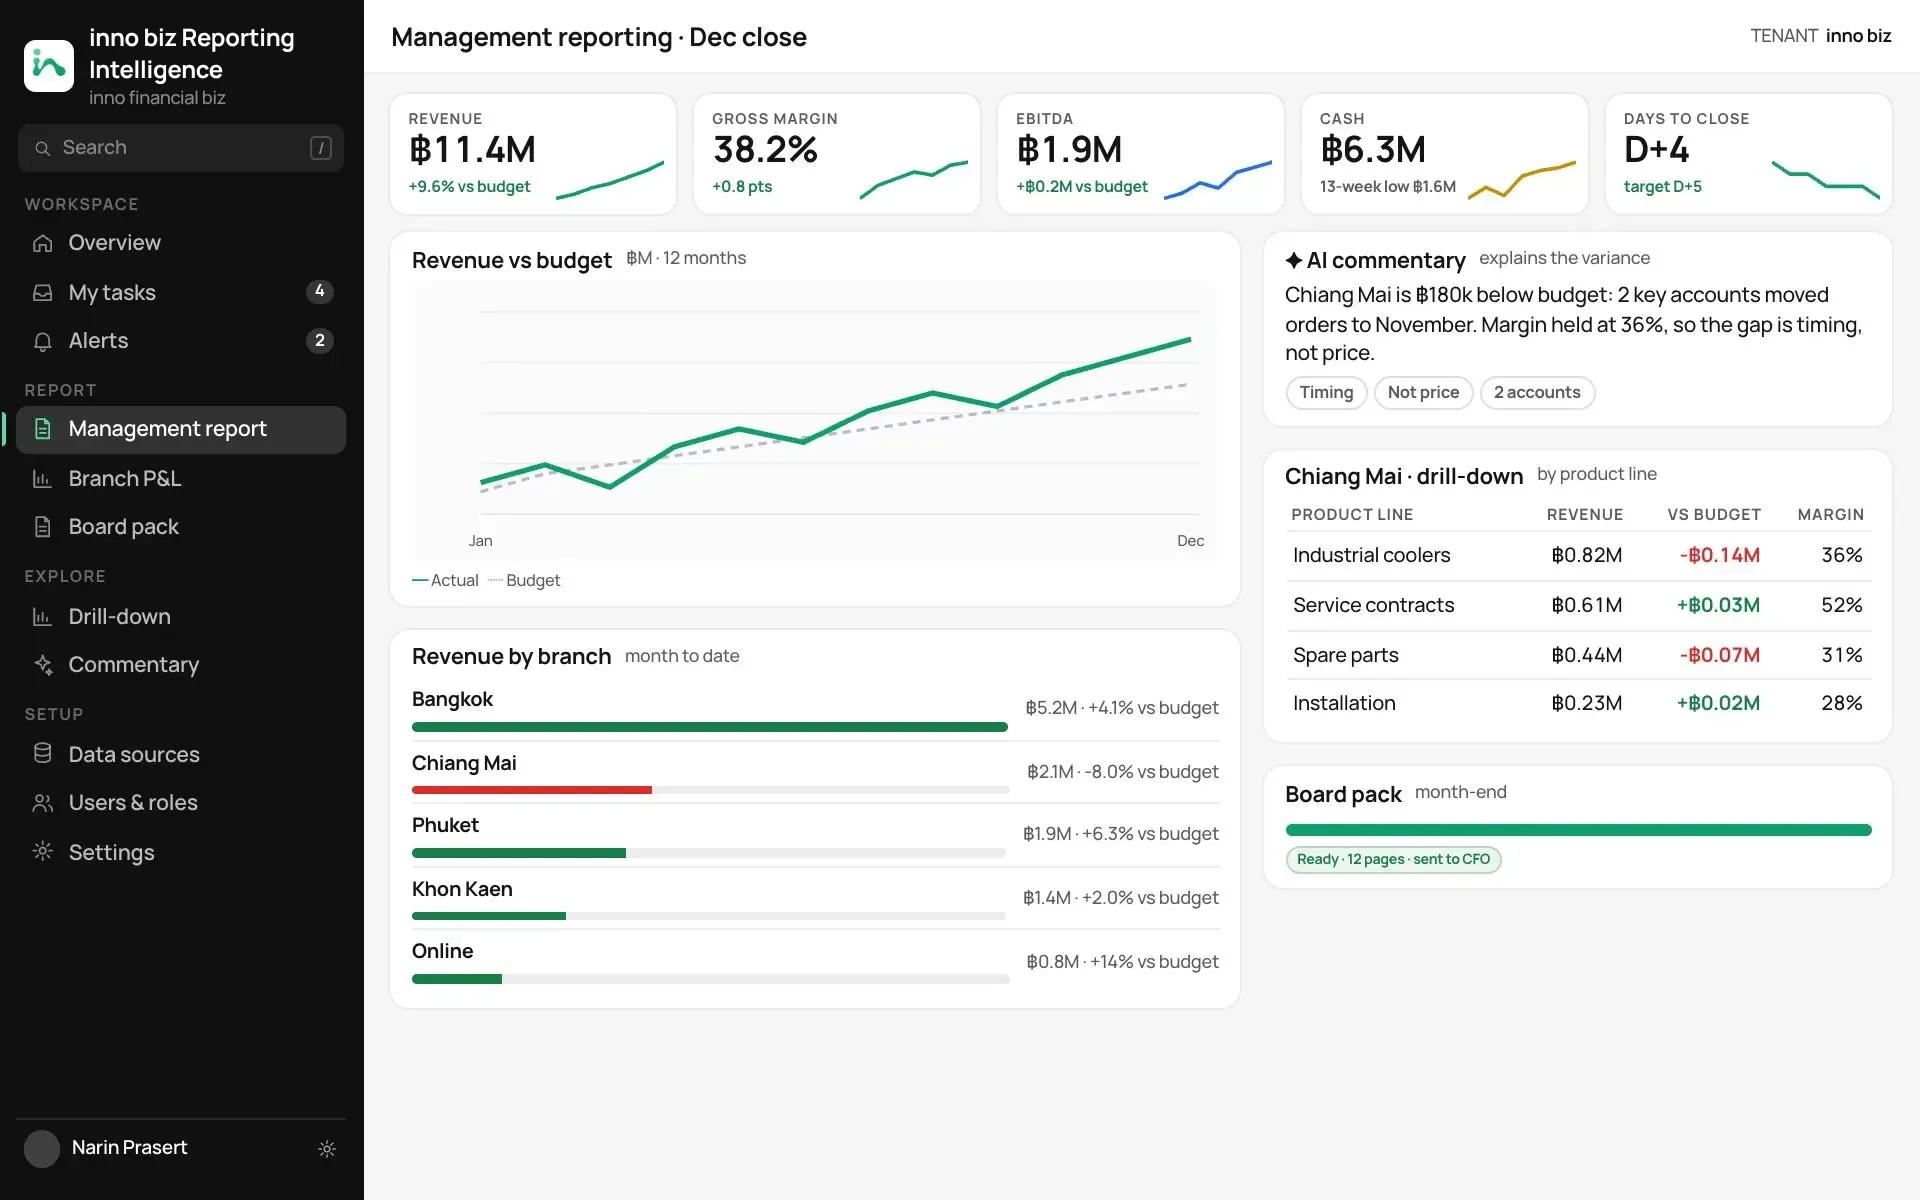
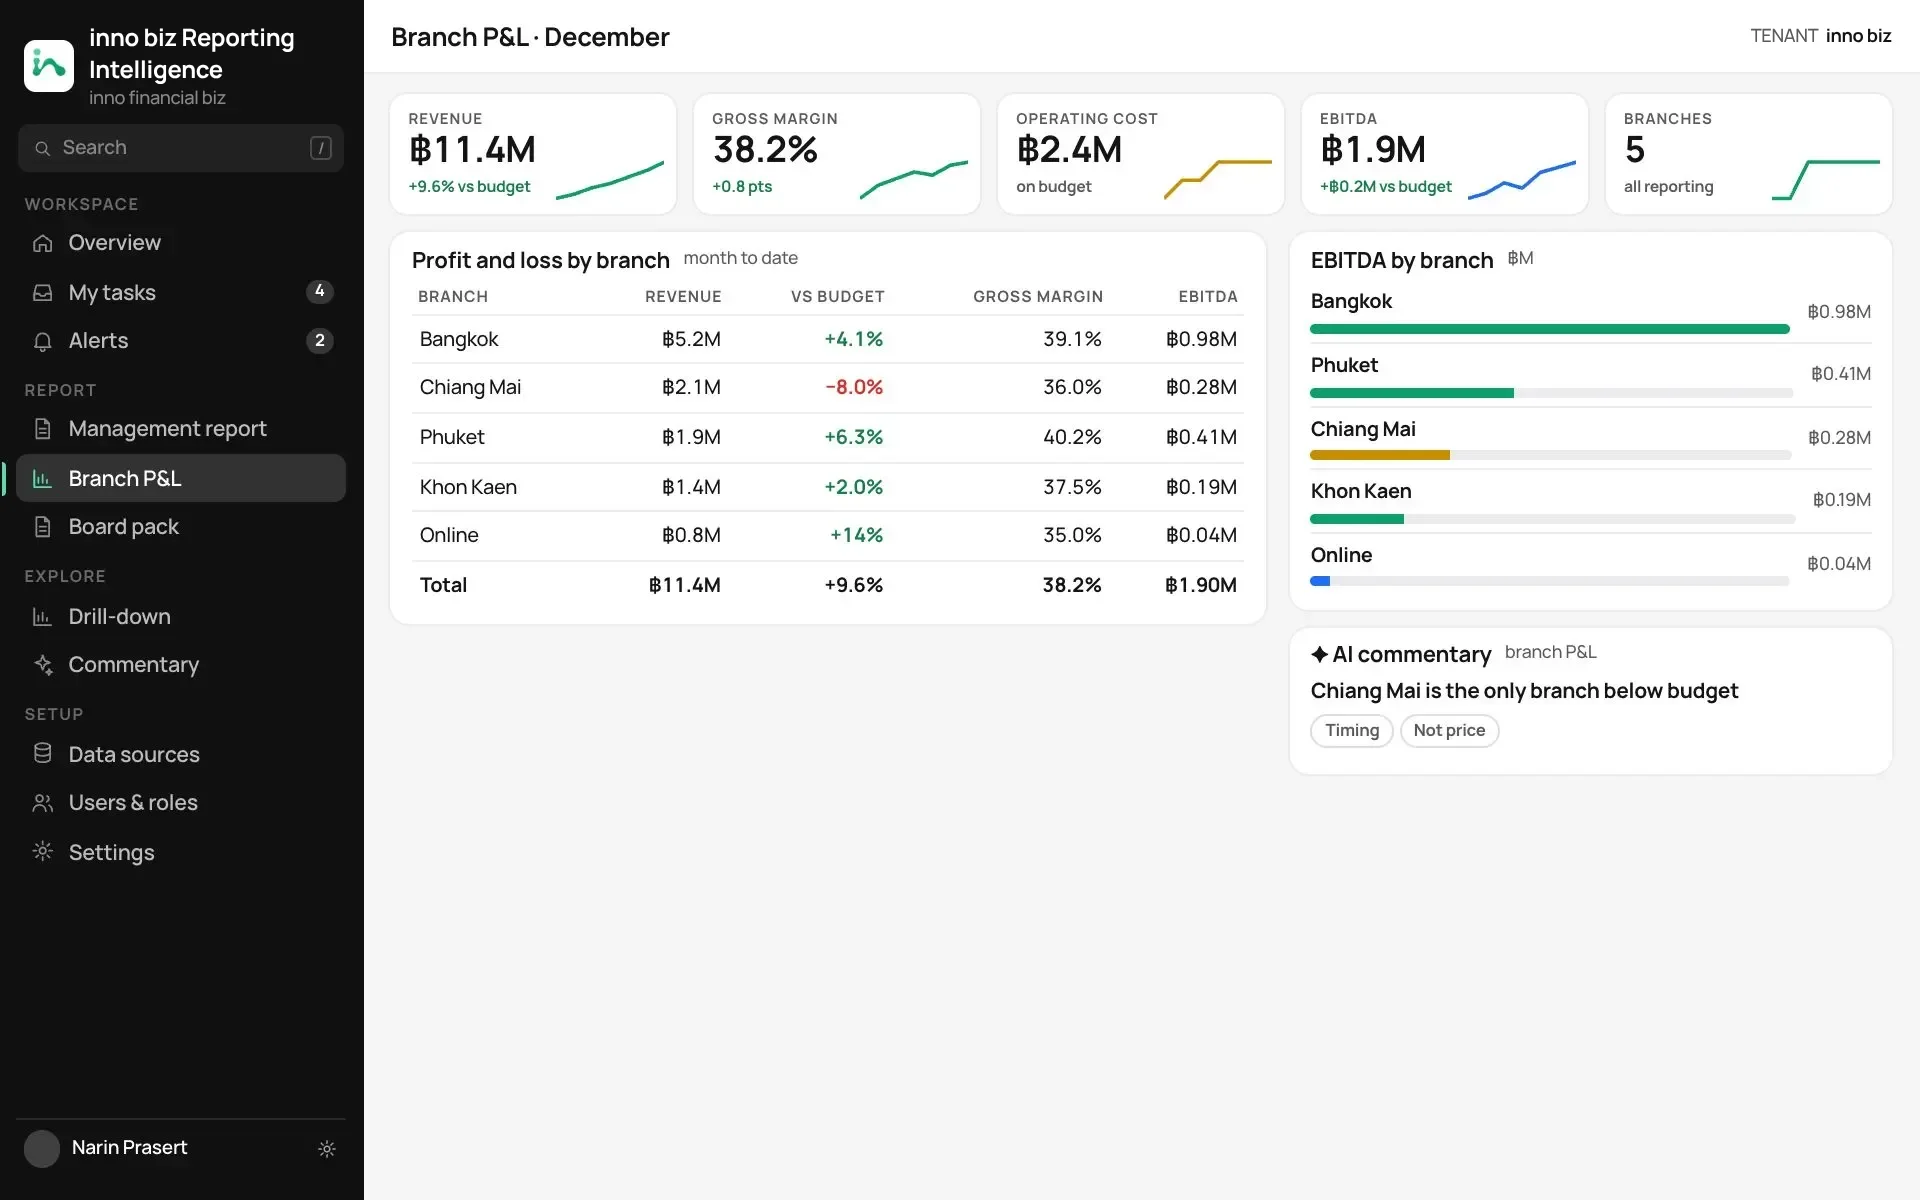
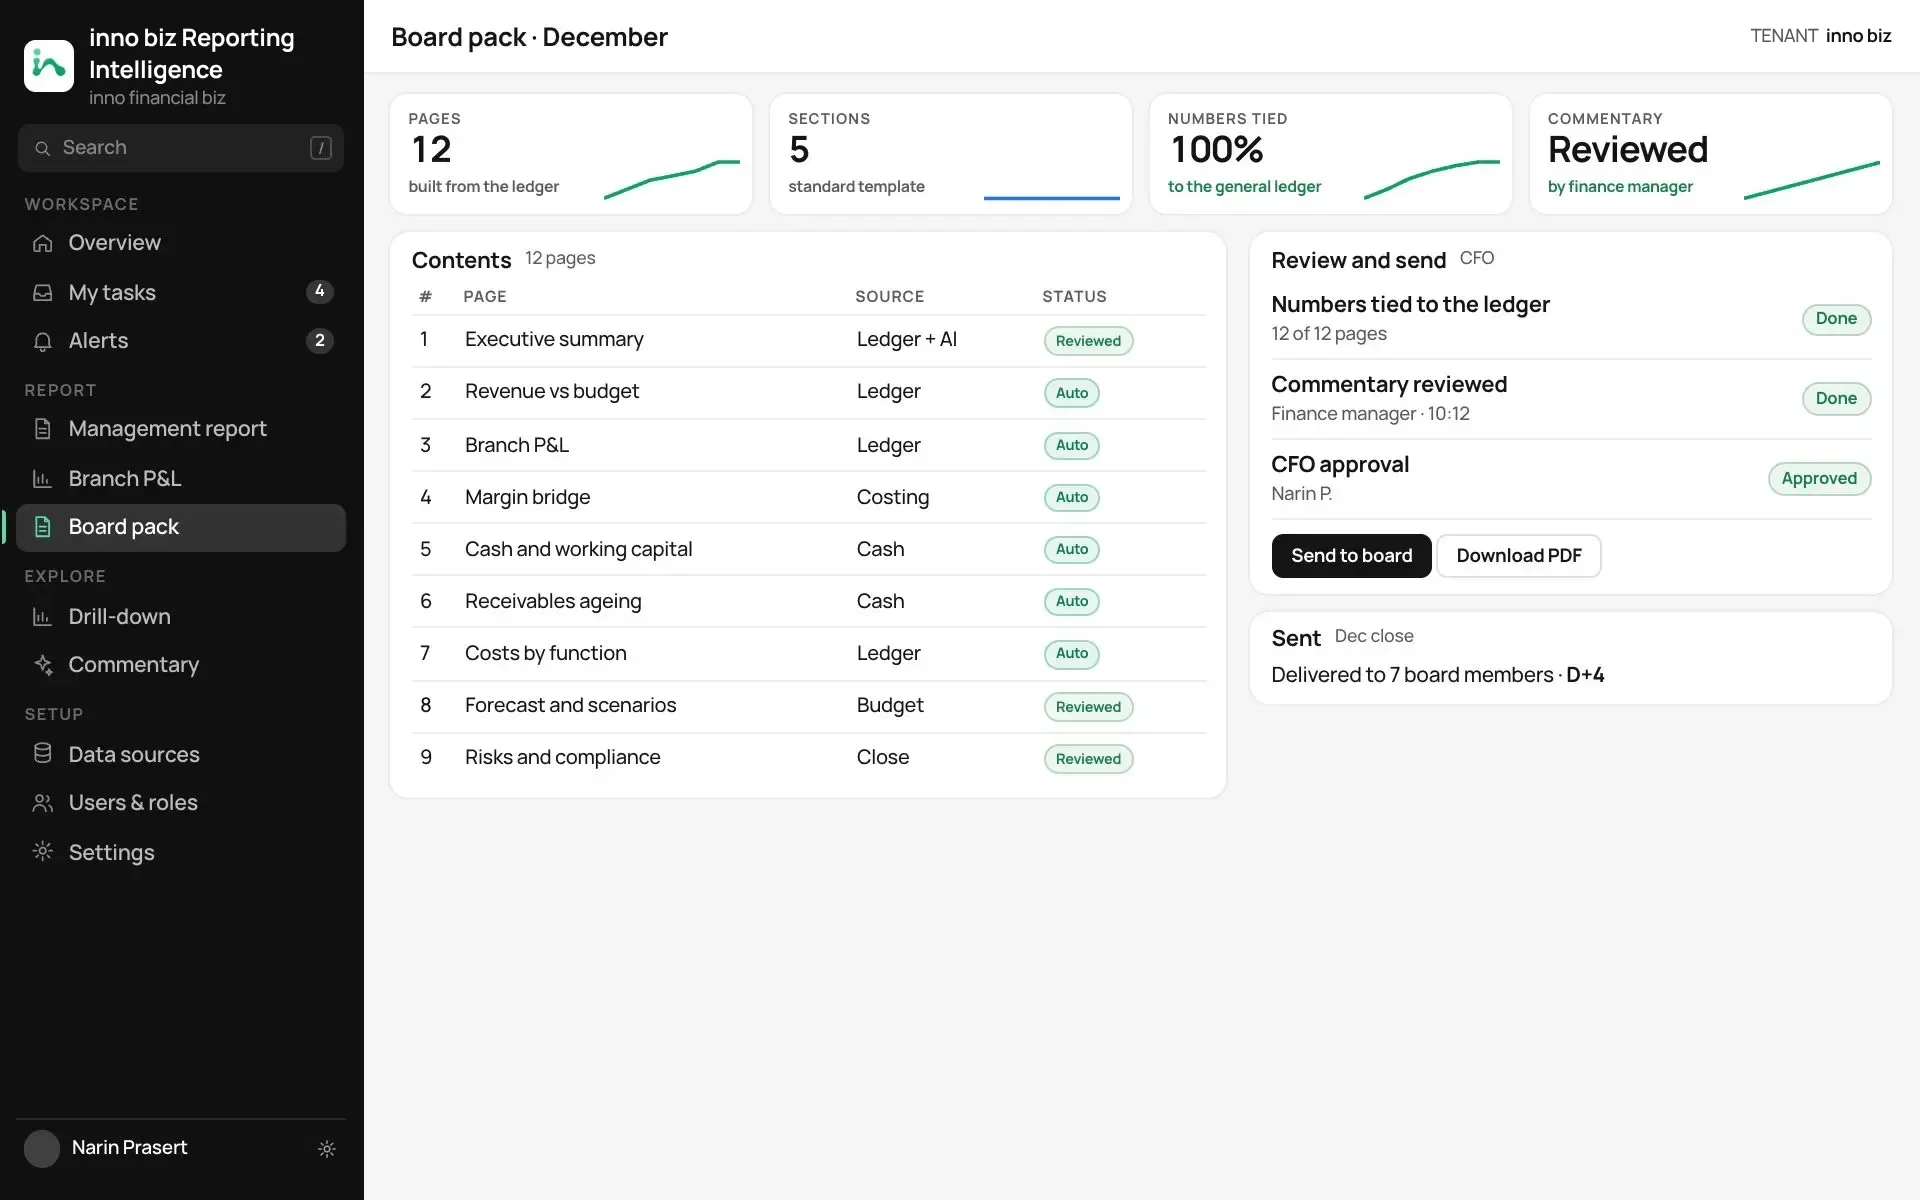
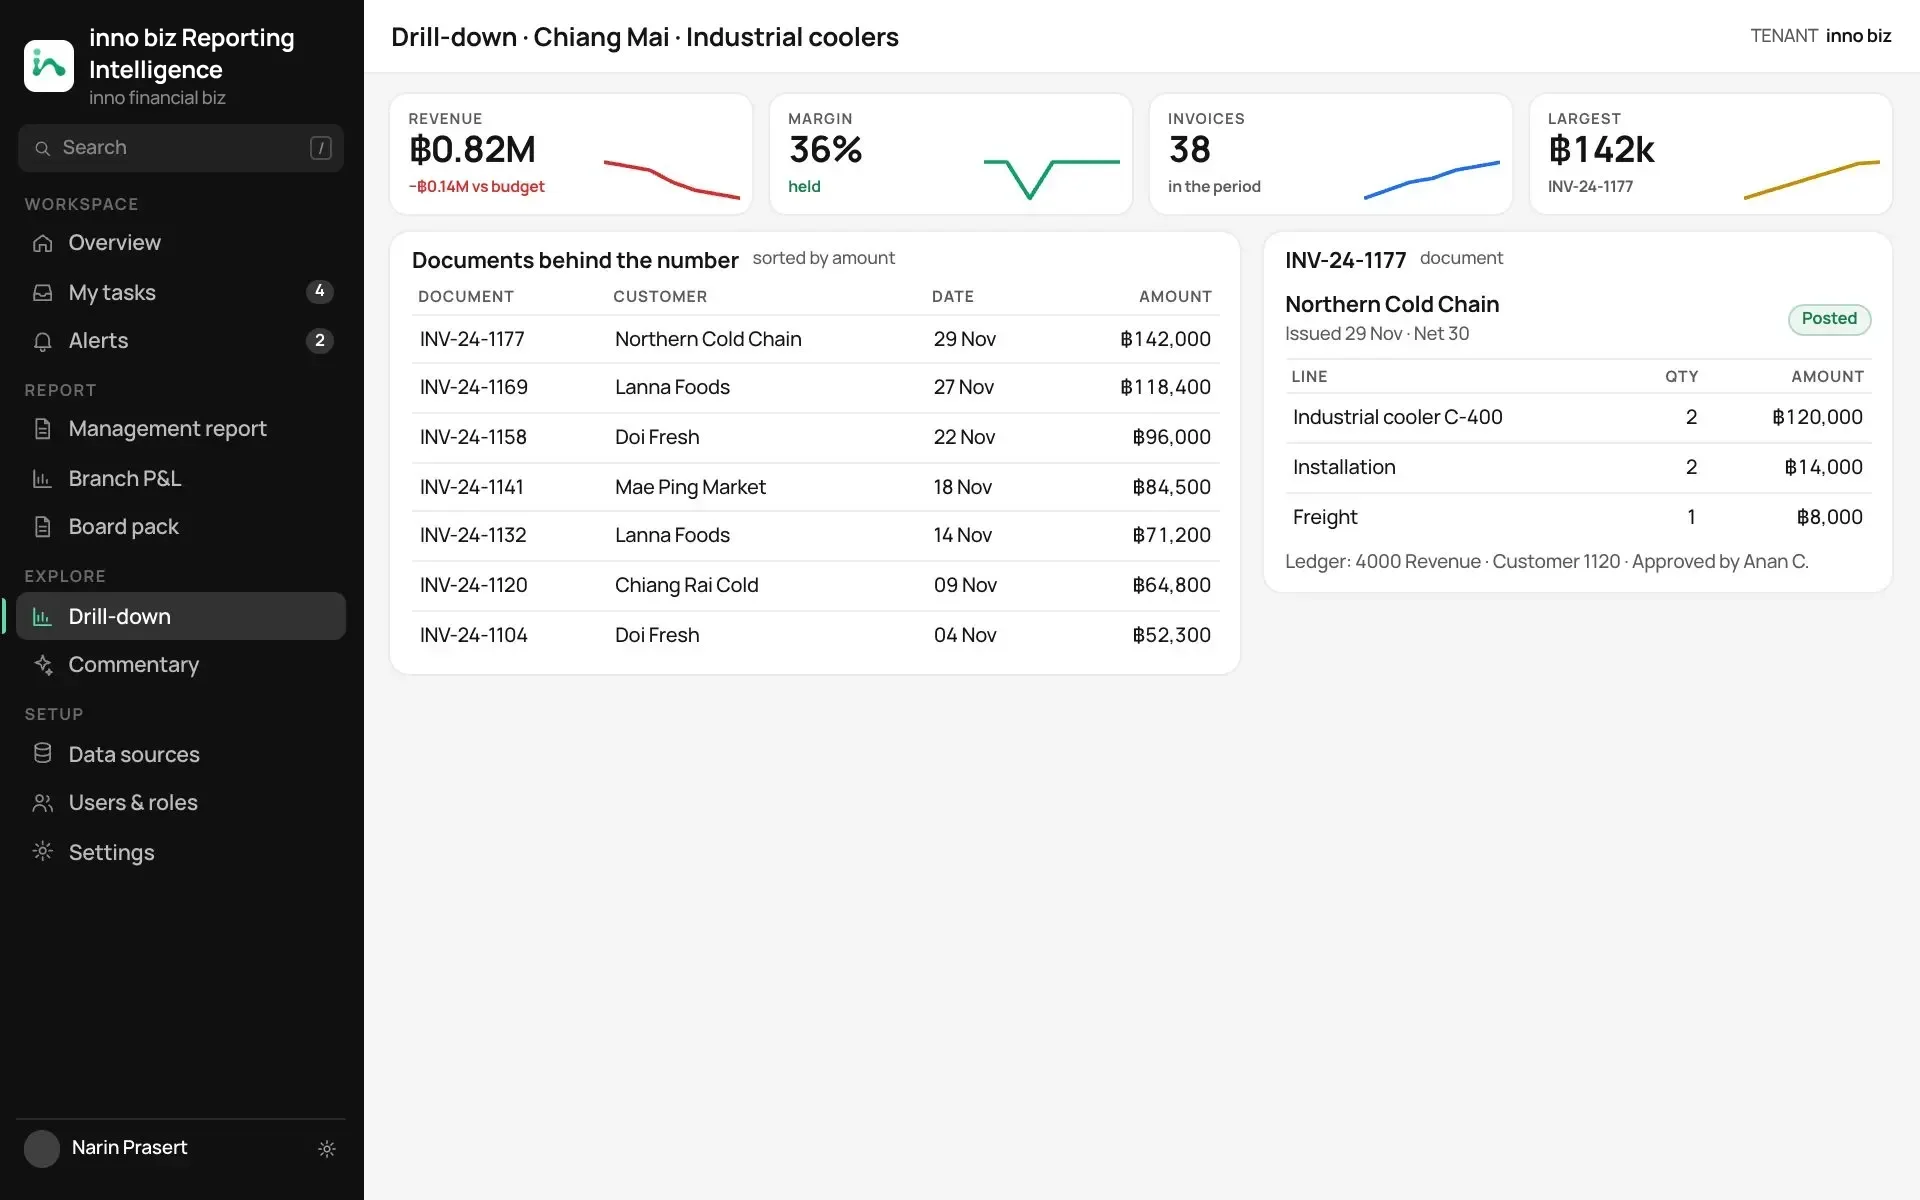
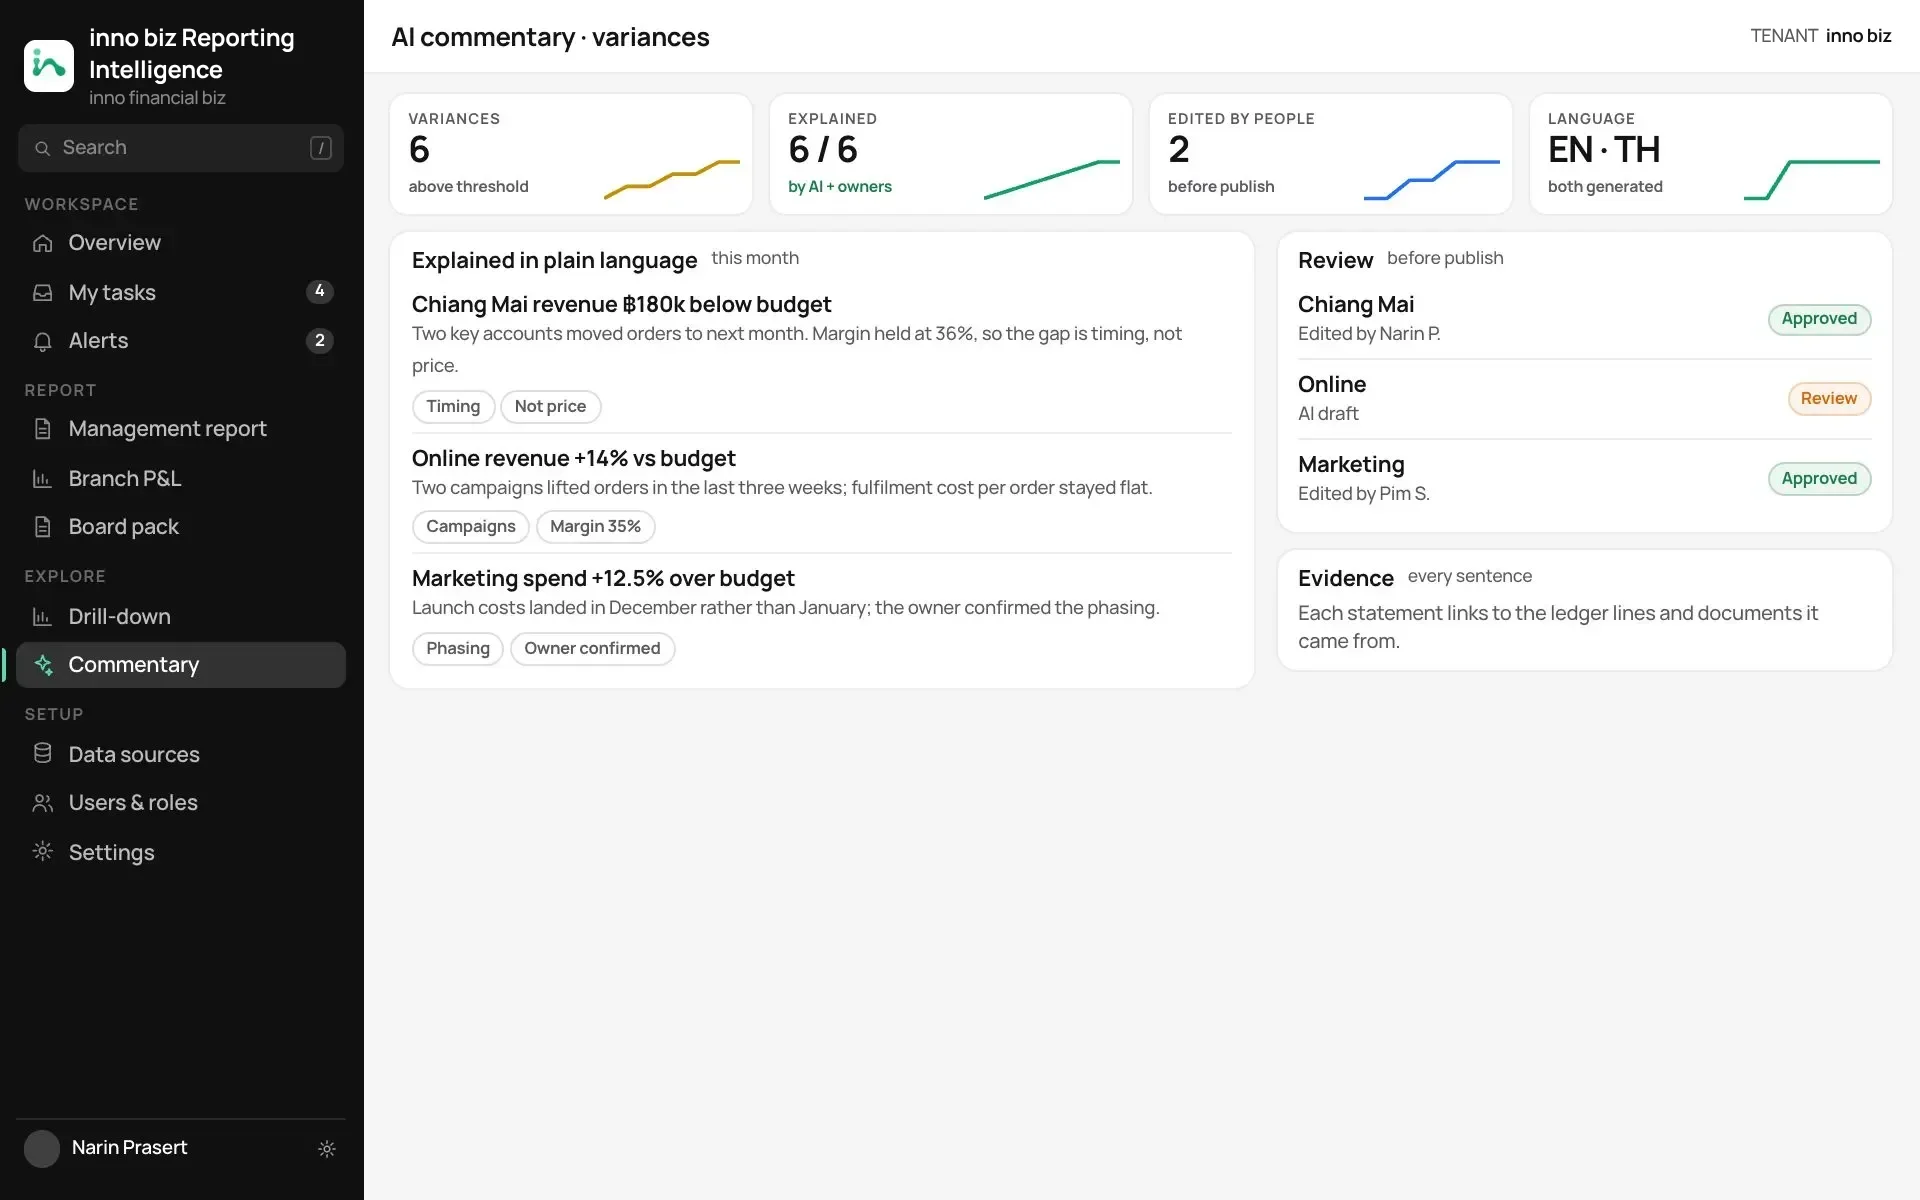
Management report. Revenue against budget, by branch, with the AI commentary beside it.Branch P&L. Profit and loss for every branch, side by side, reconciled to the ledger.Board pack. The monthly board pack assembled from the ledger, reviewed and sent.Drill-down. From a branch total to the invoice that made it, in two clicks.Commentary. Every variance explained in plain language, with the evidence behind it.
Branches, revenue and figures on these screens are sample data to show the idea.