RFID · IoT · Sensors
See the physical world.
Real-time visibility into the location, movement, condition and status of products, assets and environments — as a continuous flow of operational data.
Real-time visibility into the location, movement, condition and status of products, assets and environments — as a continuous flow of operational data.
RFID readers, people counters, shelf sensors and chiller probes sit on the floor plan. Heat builds where customers go, tags move as visitors do, and events stream in beside the map.
A chiller drifts above its limit. The screen shows the temperature curve, the stock at risk found through RFID, and one tap to notify the store manager or open a ticket.
Dwell time by zone, the visit funnel from entering to paying, and footfall by hour, all drawn from the devices already on the floor.
Use the menu on the left, or the tabs below — every screen is a page of the product, with sample data.
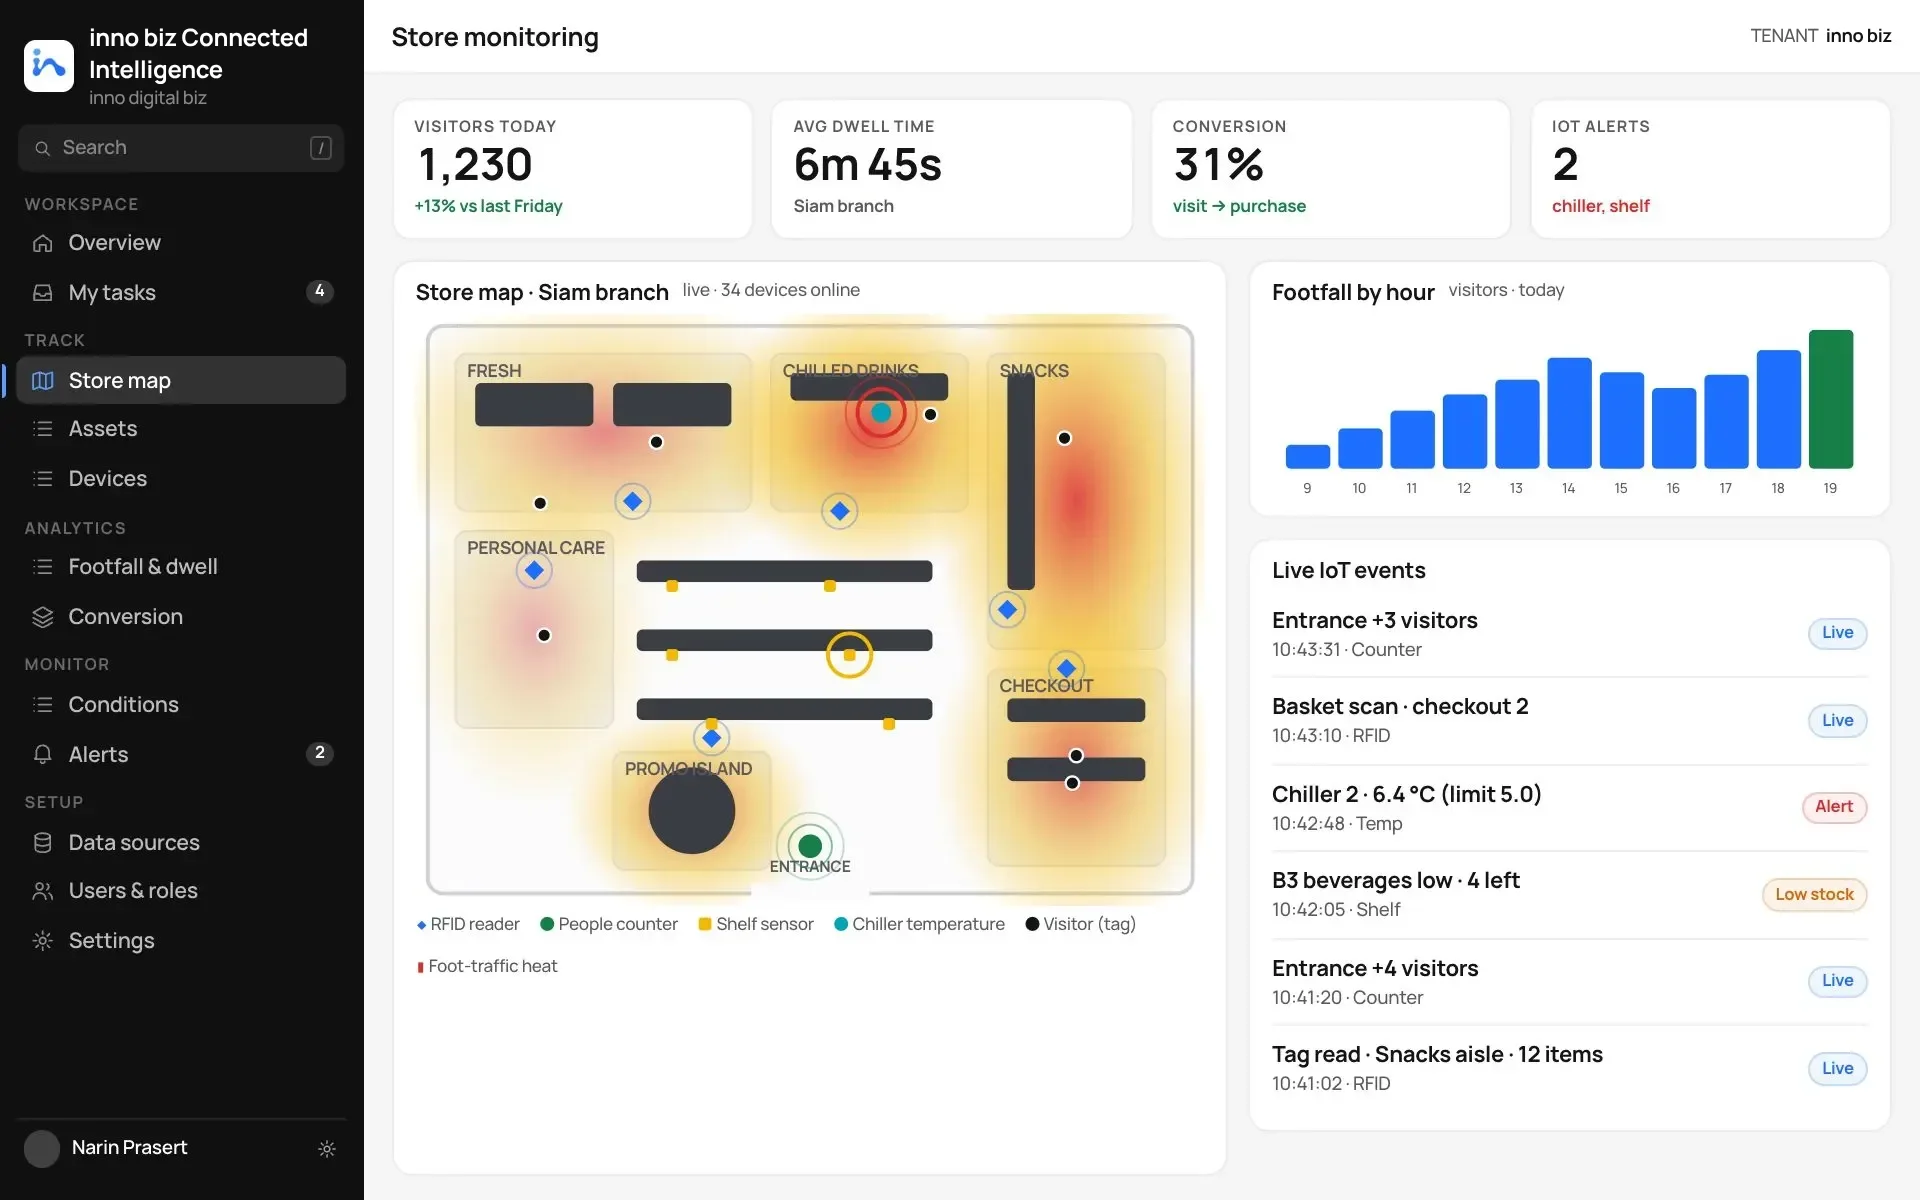
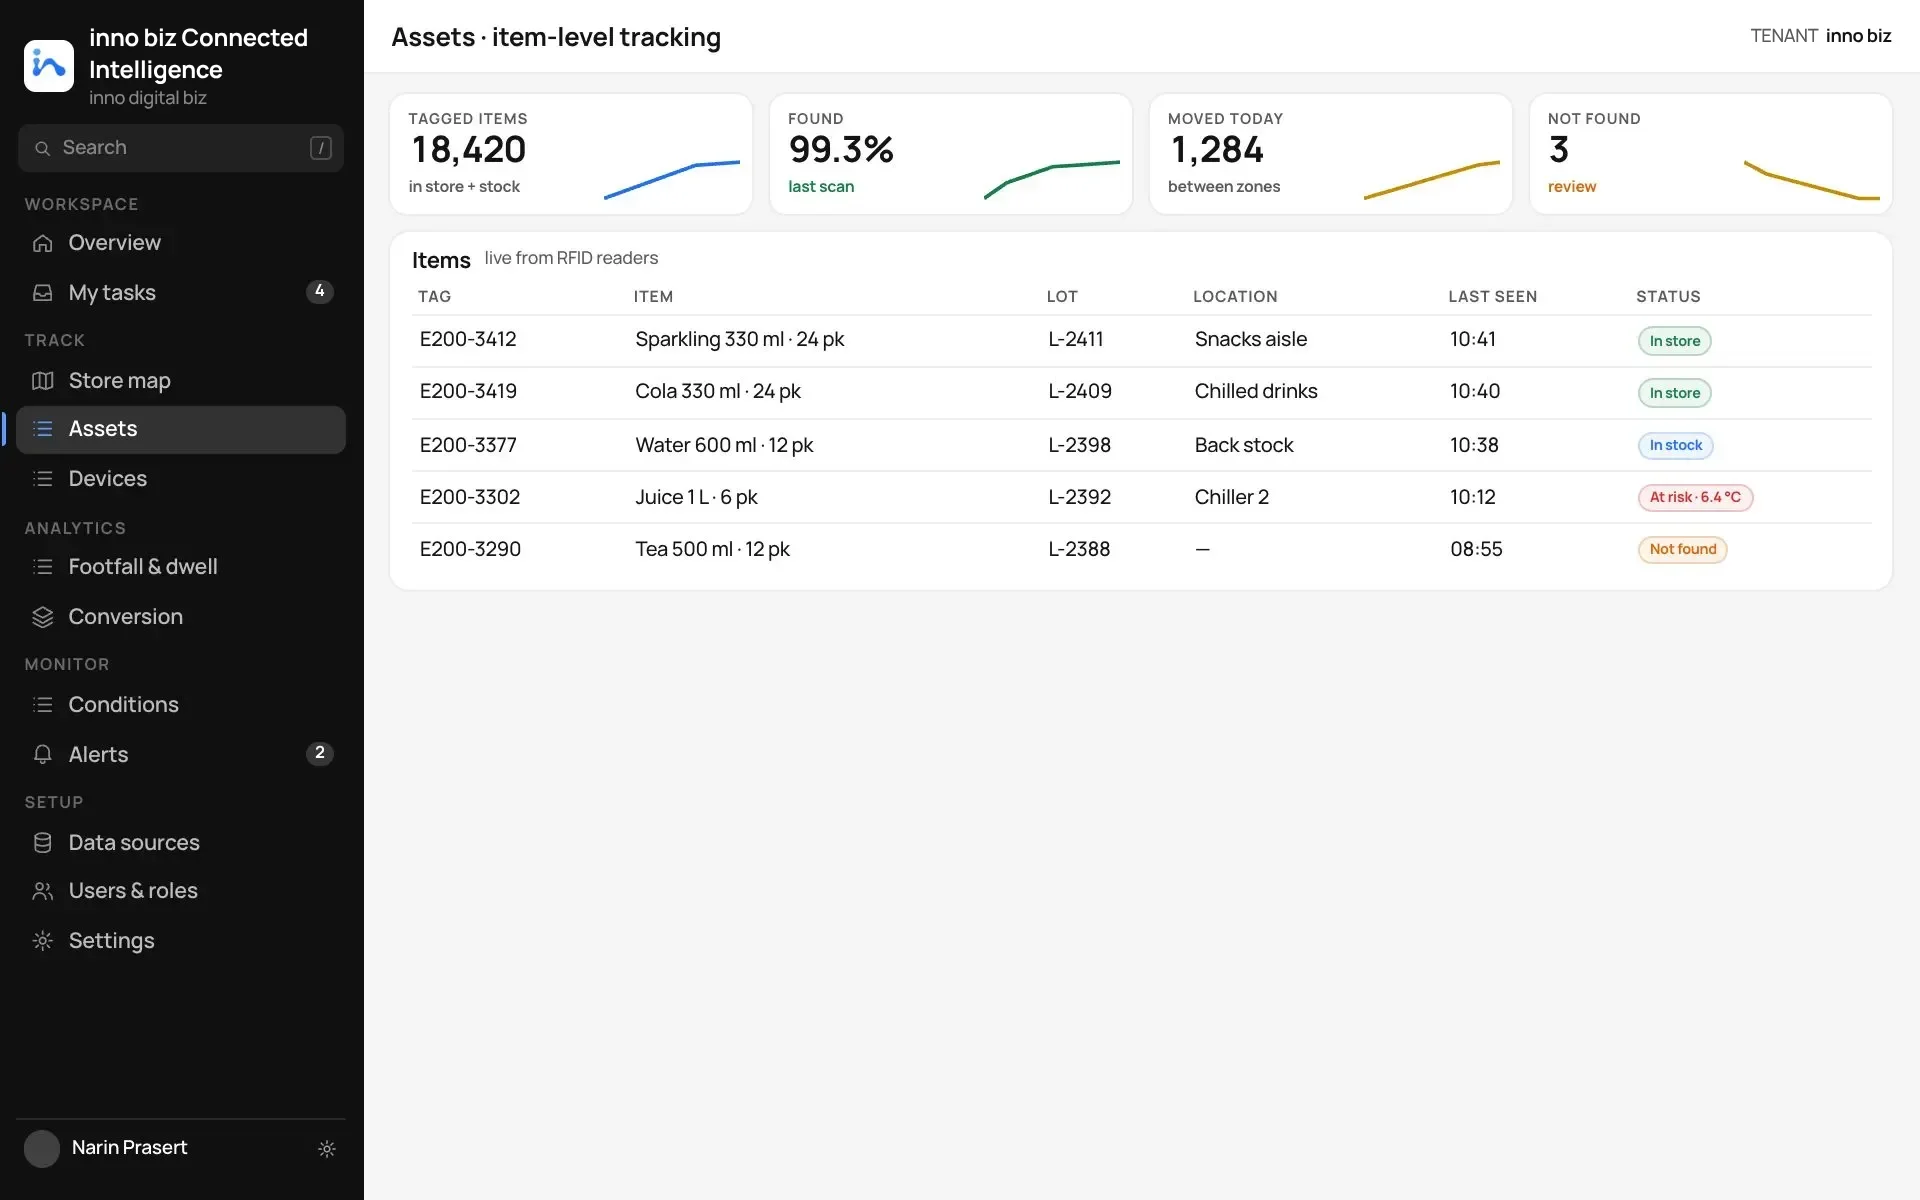
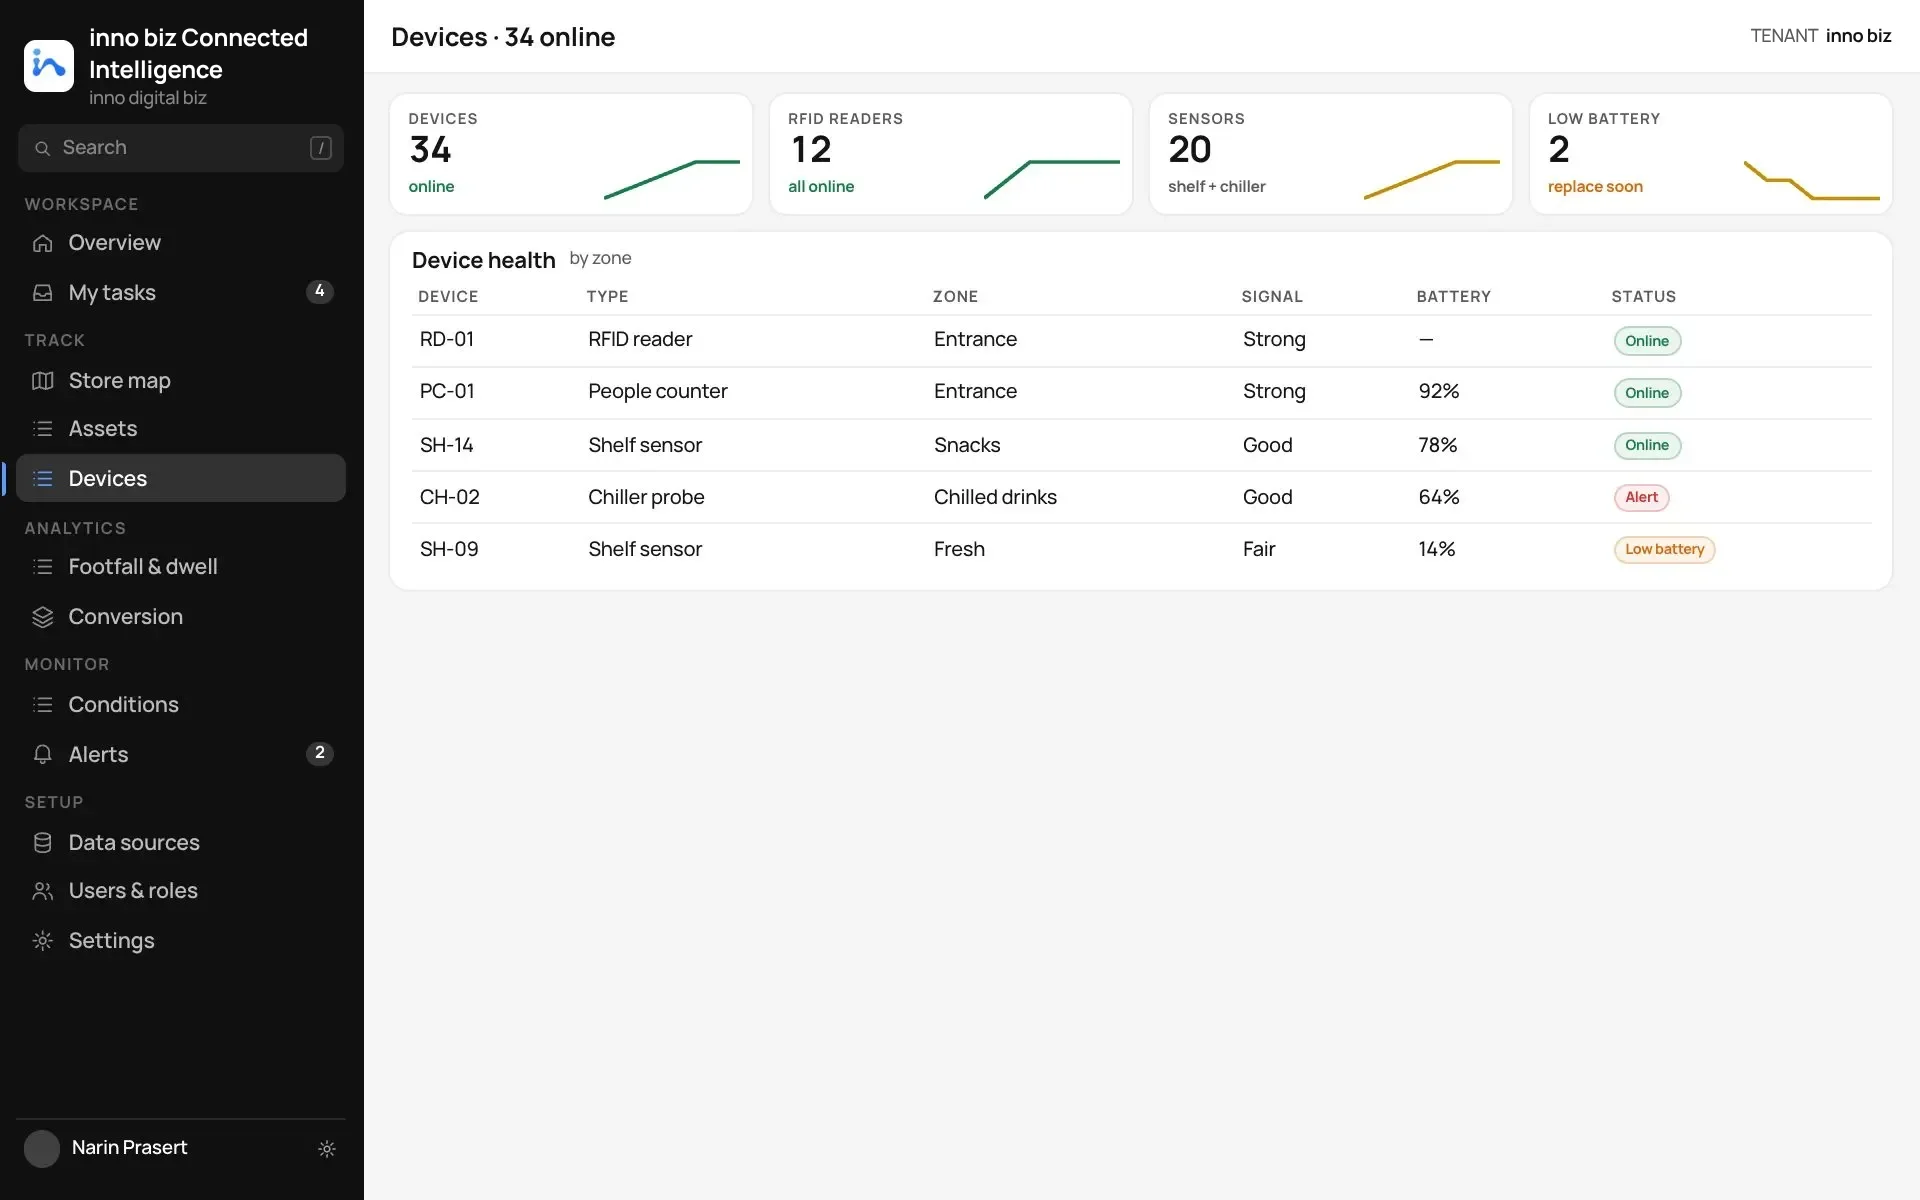
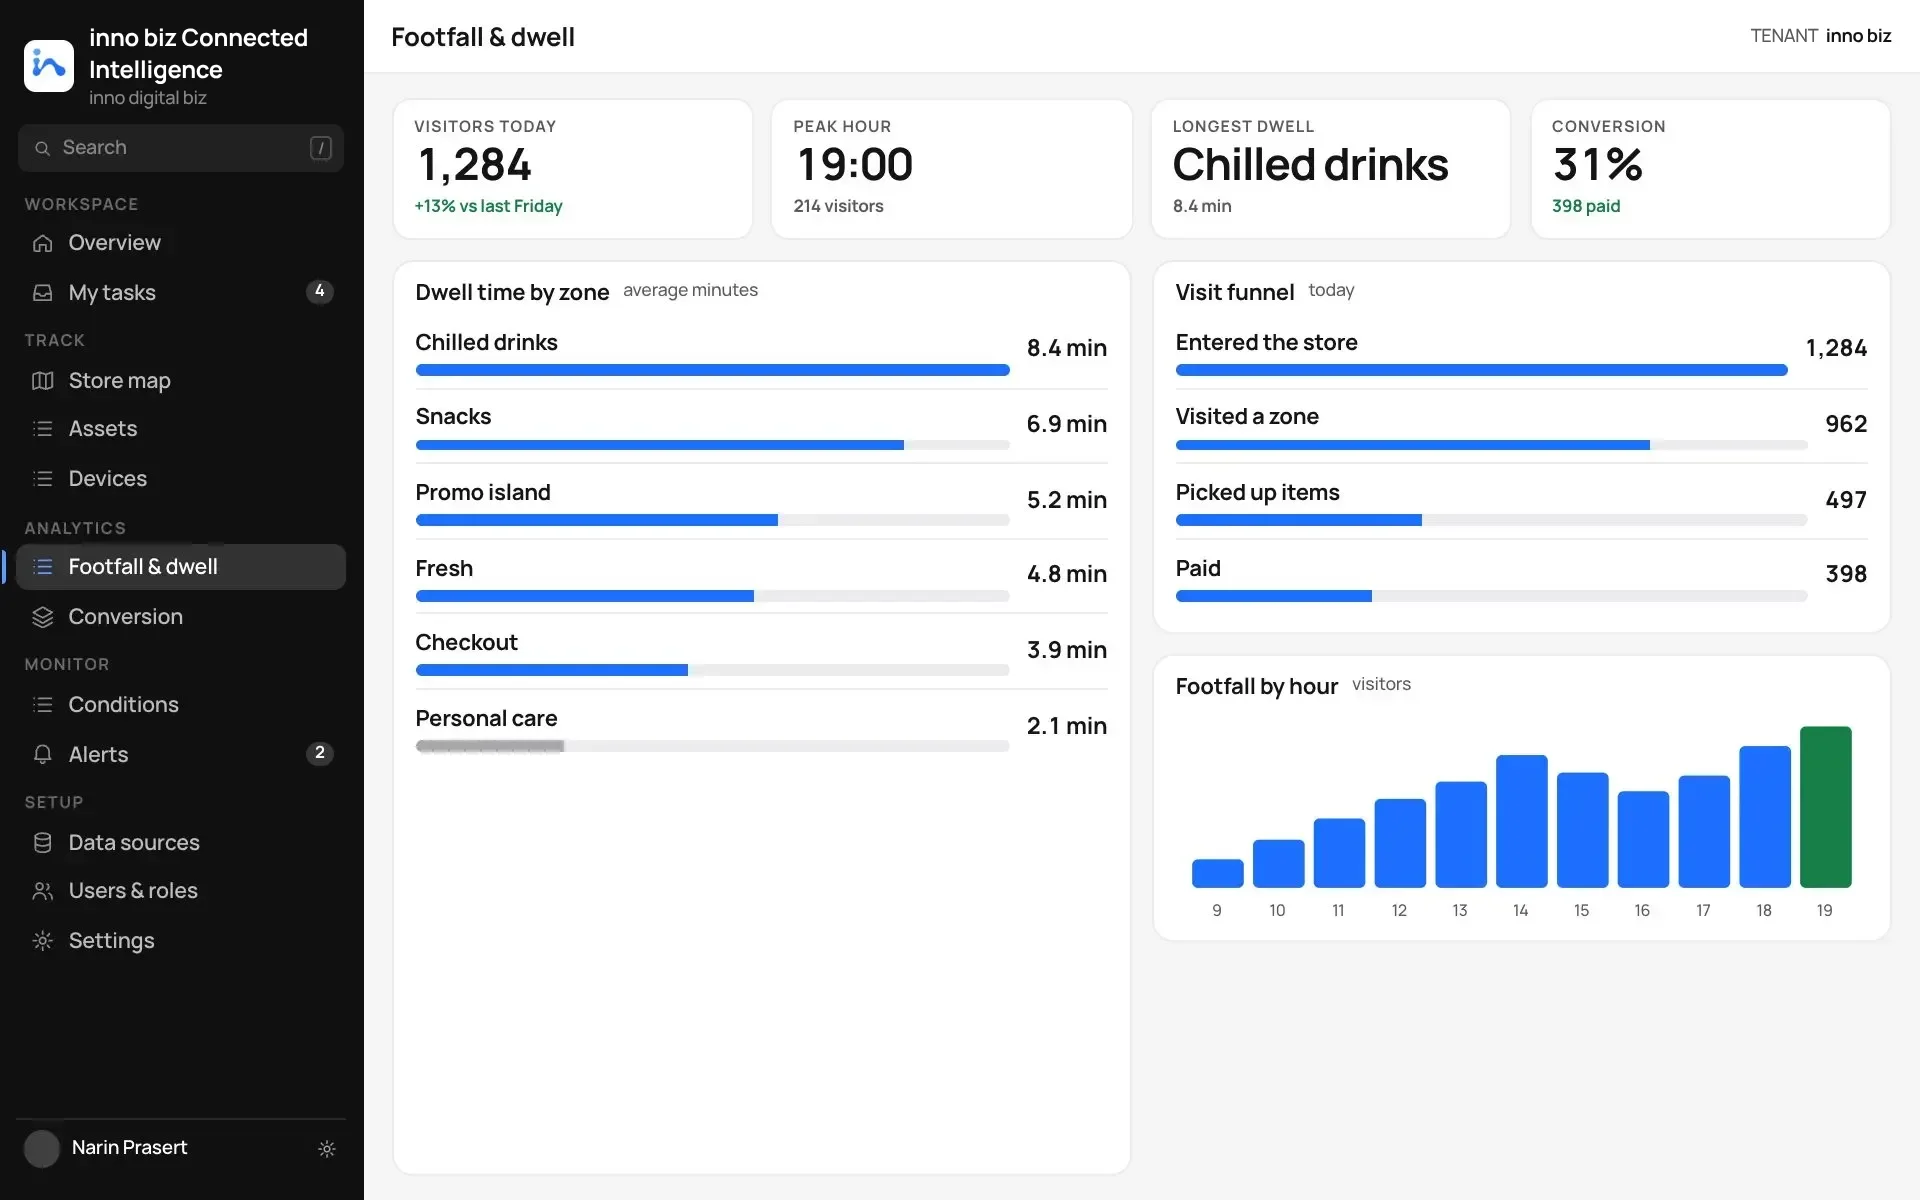
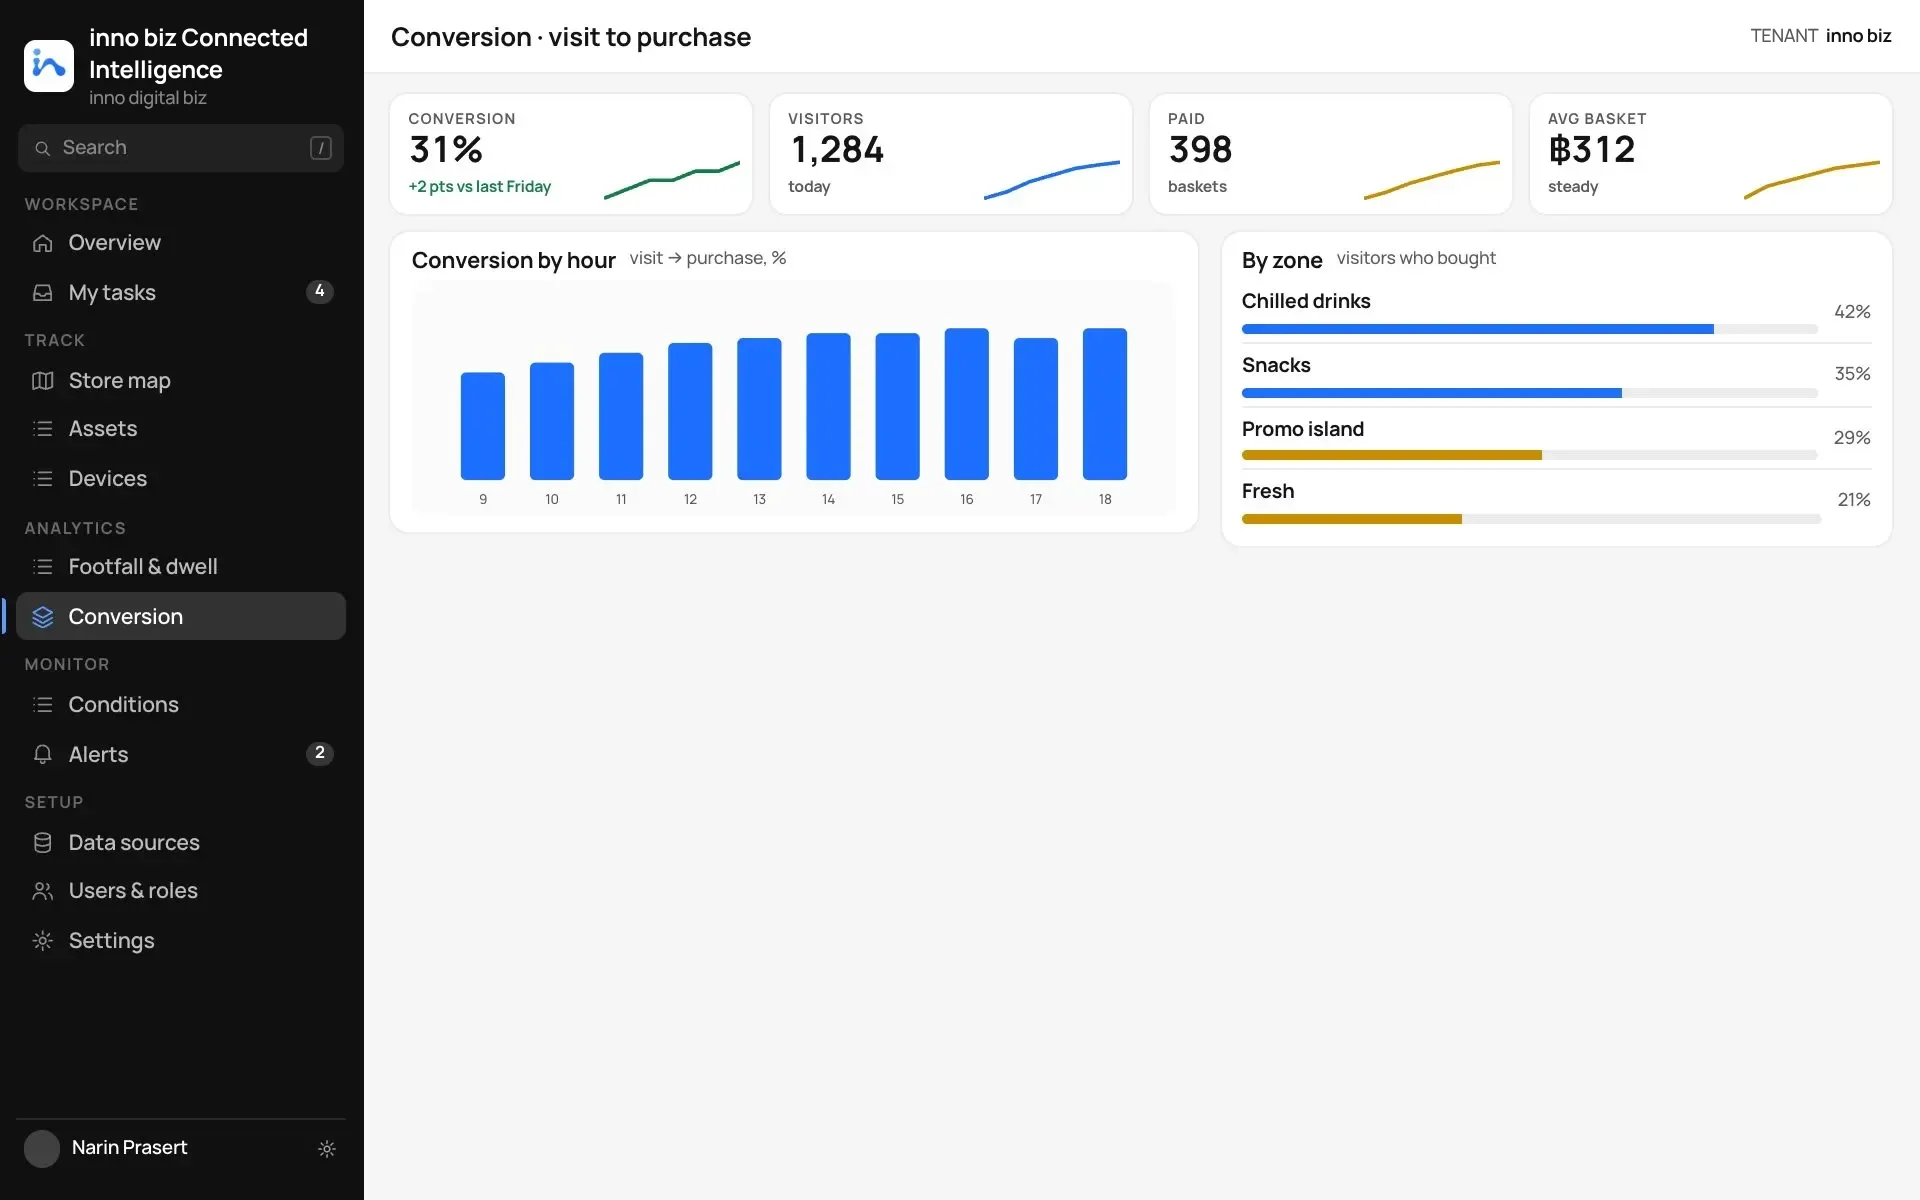
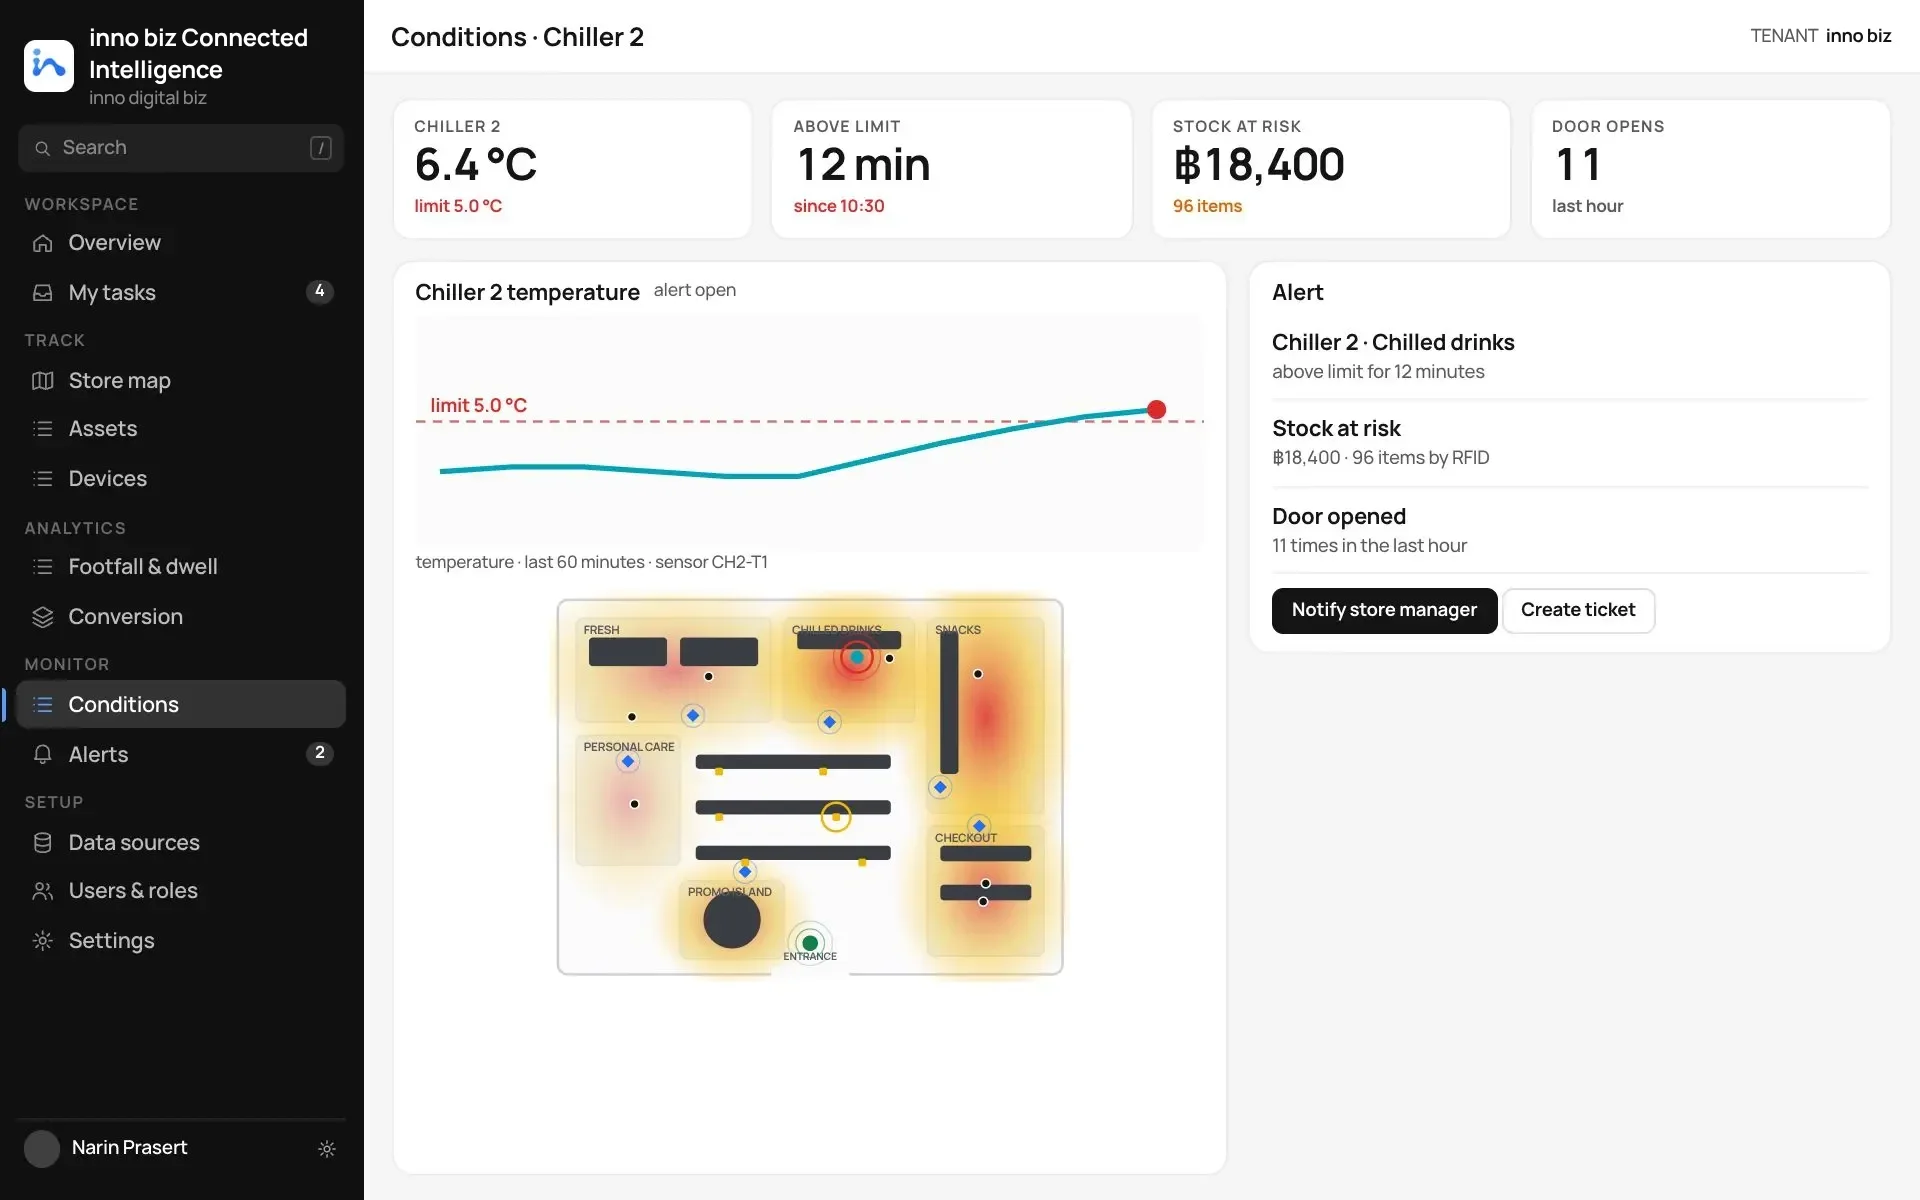
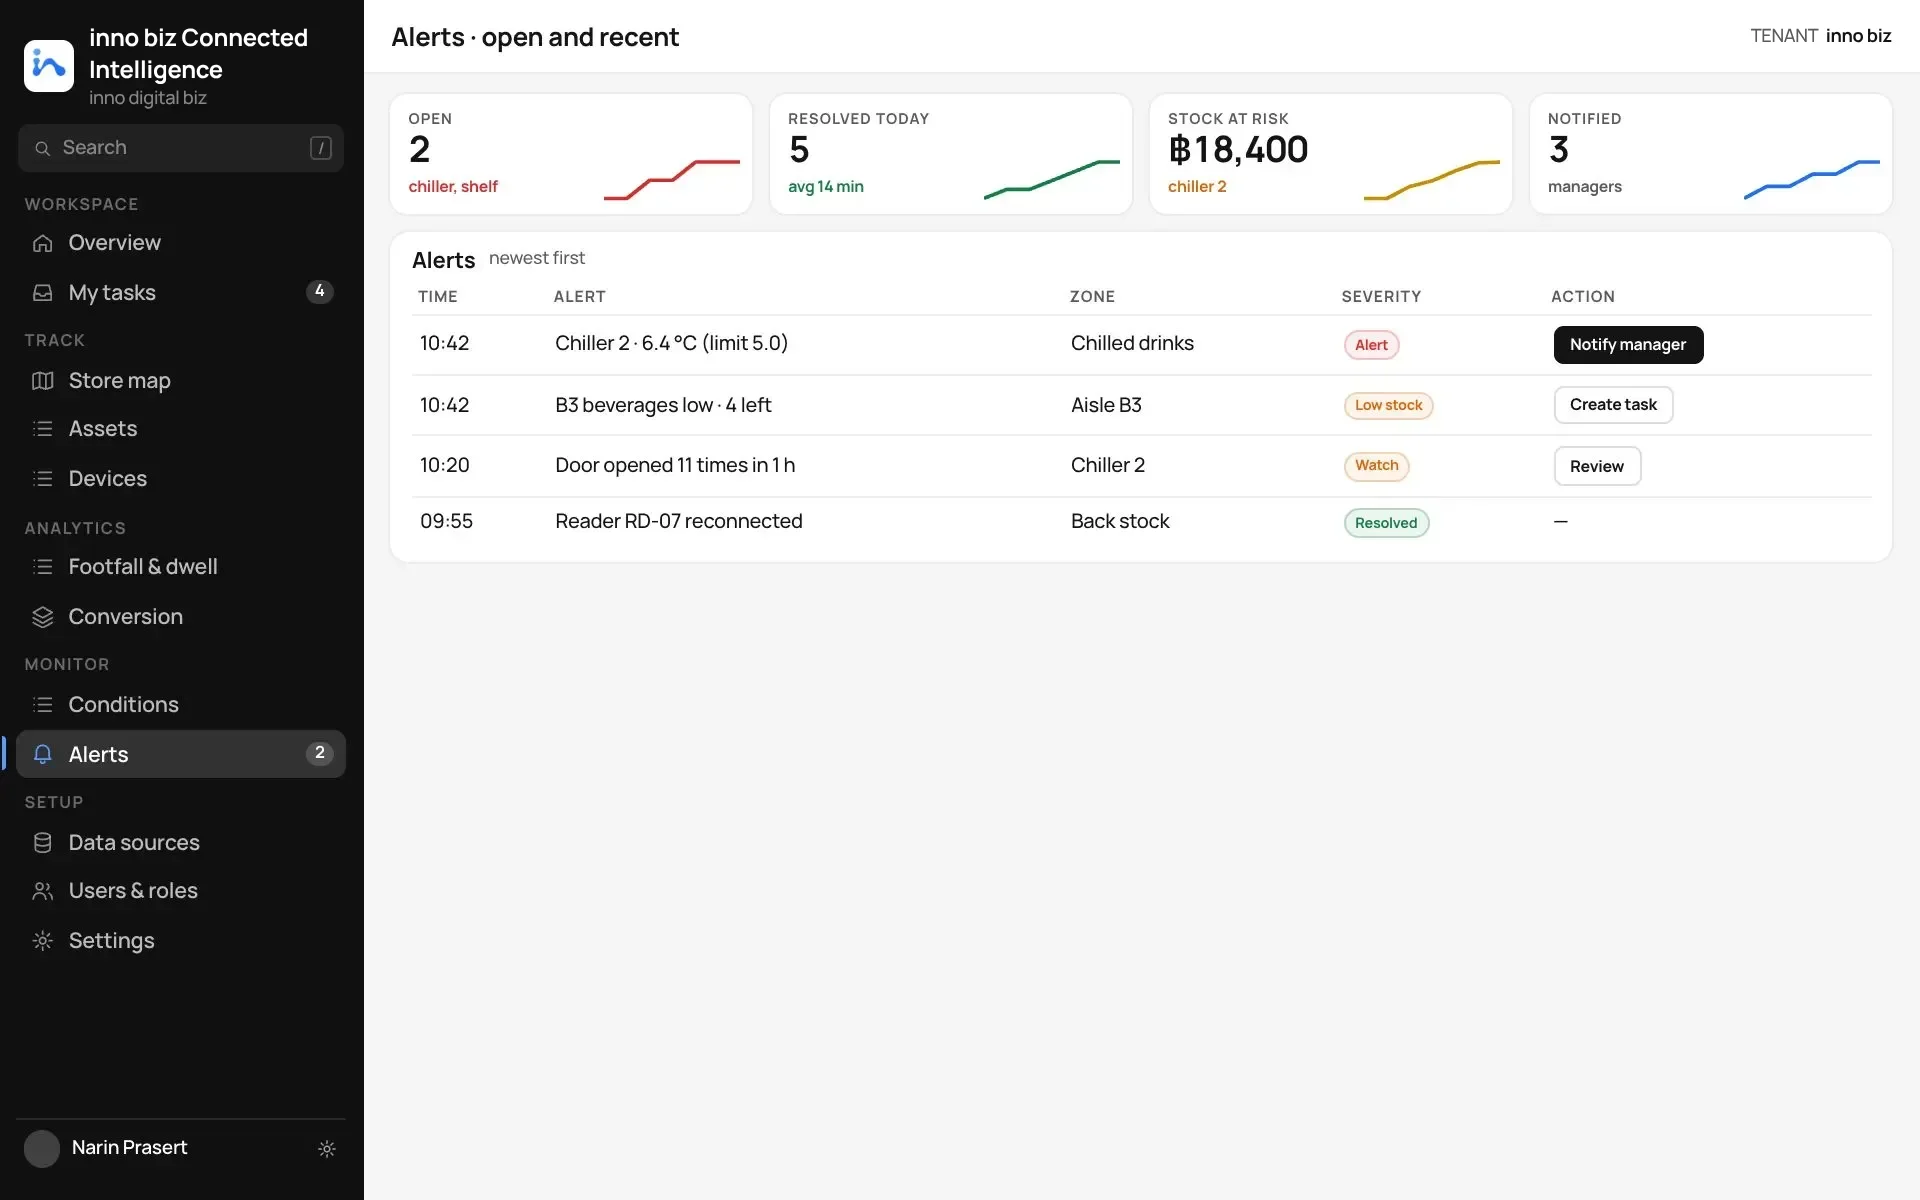
Store map. The live store map: devices, foot-traffic heat and events.Assets. Every tagged item with its lot, location and last read.Devices. Every reader and sensor in the store, with its signal and battery.Footfall & dwell. Dwell time by zone, the visit funnel and footfall by hour.Conversion. Where visitors turn into buyers, by hour and by zone.Conditions. A chiller above its limit, with the stock at risk.Alerts. Alerts raised from the sensors, with the action one click away.
Store layout, device positions and readings on these screens are sample data to show the idea.