Budget · Forecast · Scenarios
Budgets people actually use.
Budgets and rolling forecasts owned by the people who run the numbers, with variance explained while there is still time to act on it.
Budgets and rolling forecasts owned by the people who run the numbers, with variance explained while there is still time to act on it.
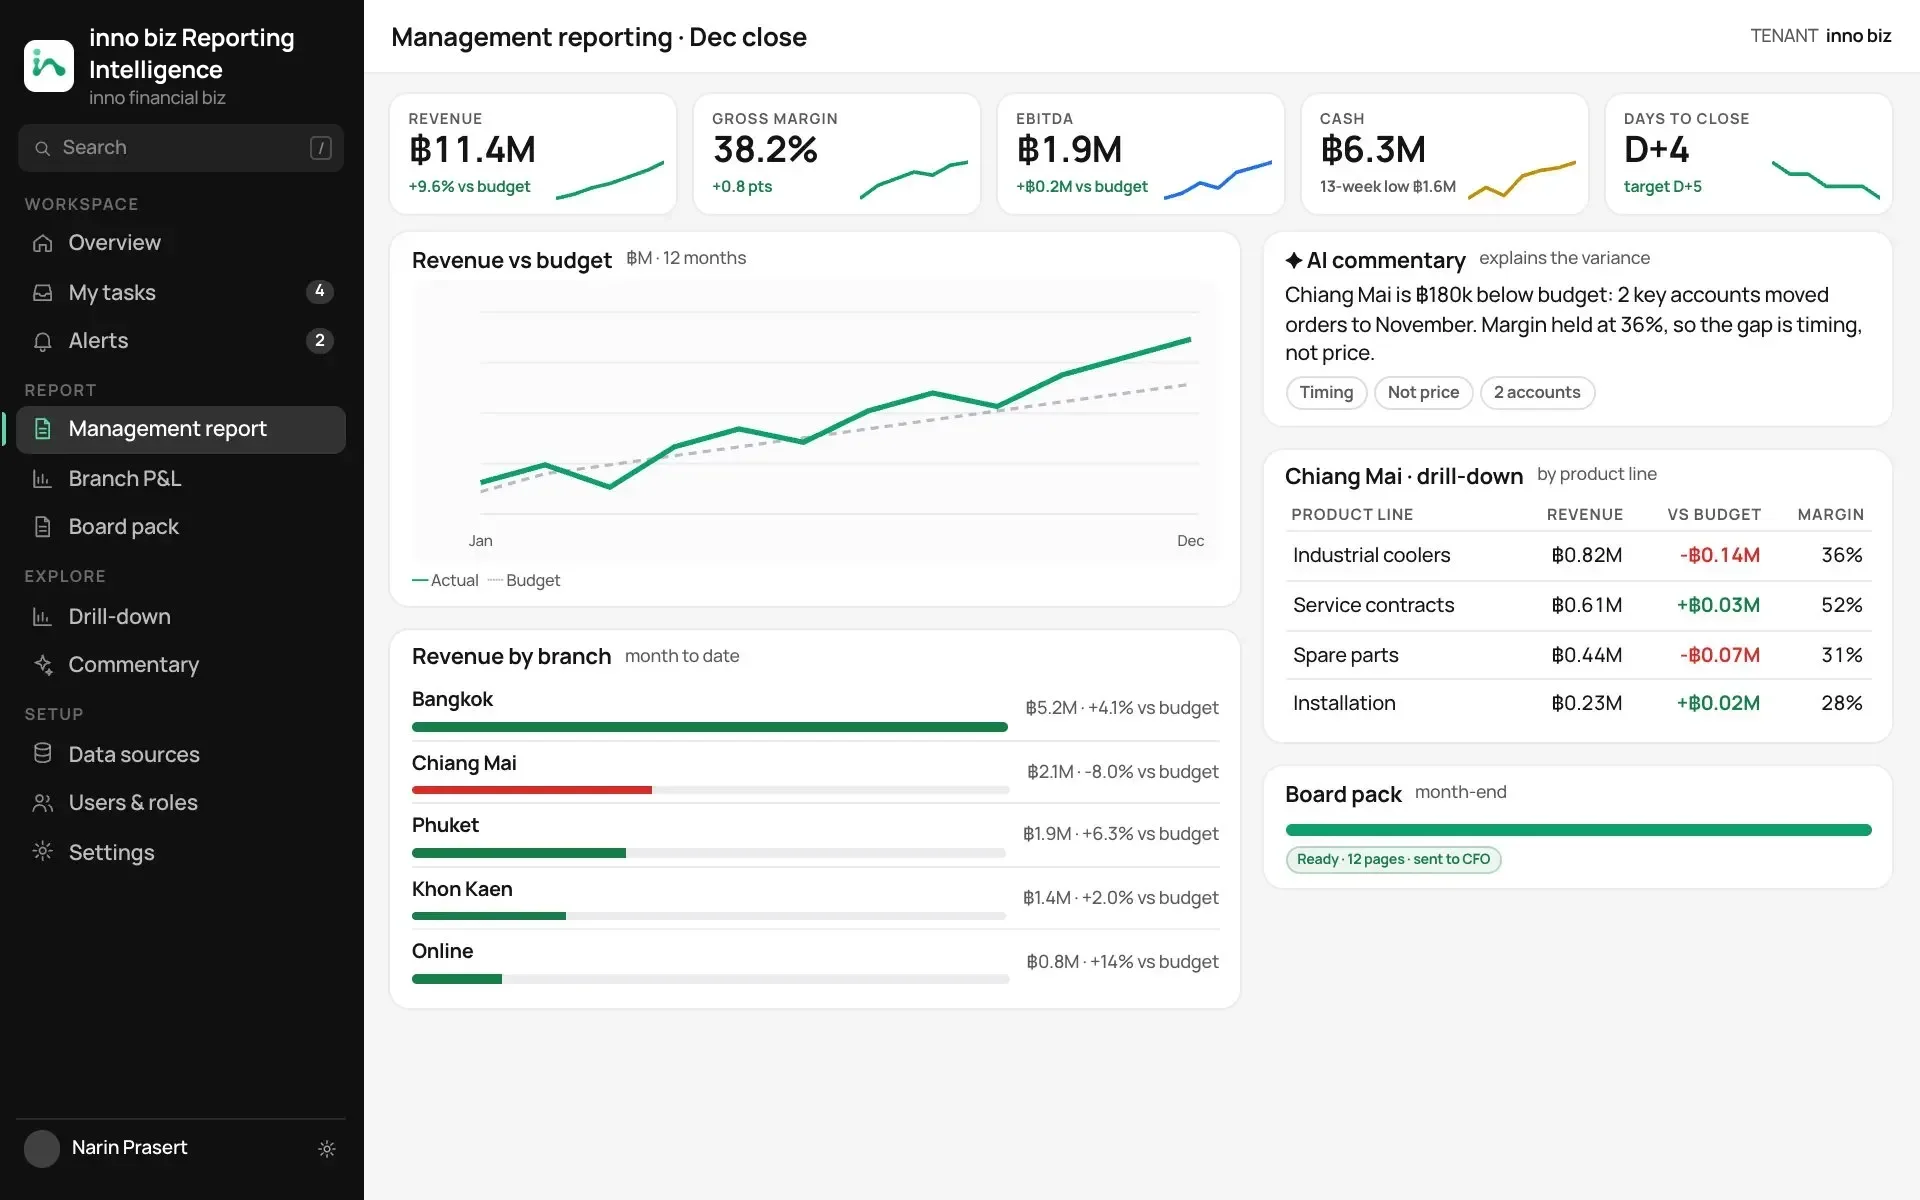
Revenue per month is drawn as budget, actual and rolling forecast, with every line’s variance explained by its owner underneath.
Switch to the downside and the forecast redraws: full-year EBITDA drops, with the lines still above budget flagged.
Phase the hires and cap marketing at budget — the effect on EBITDA is shown before the plan goes to the owners.
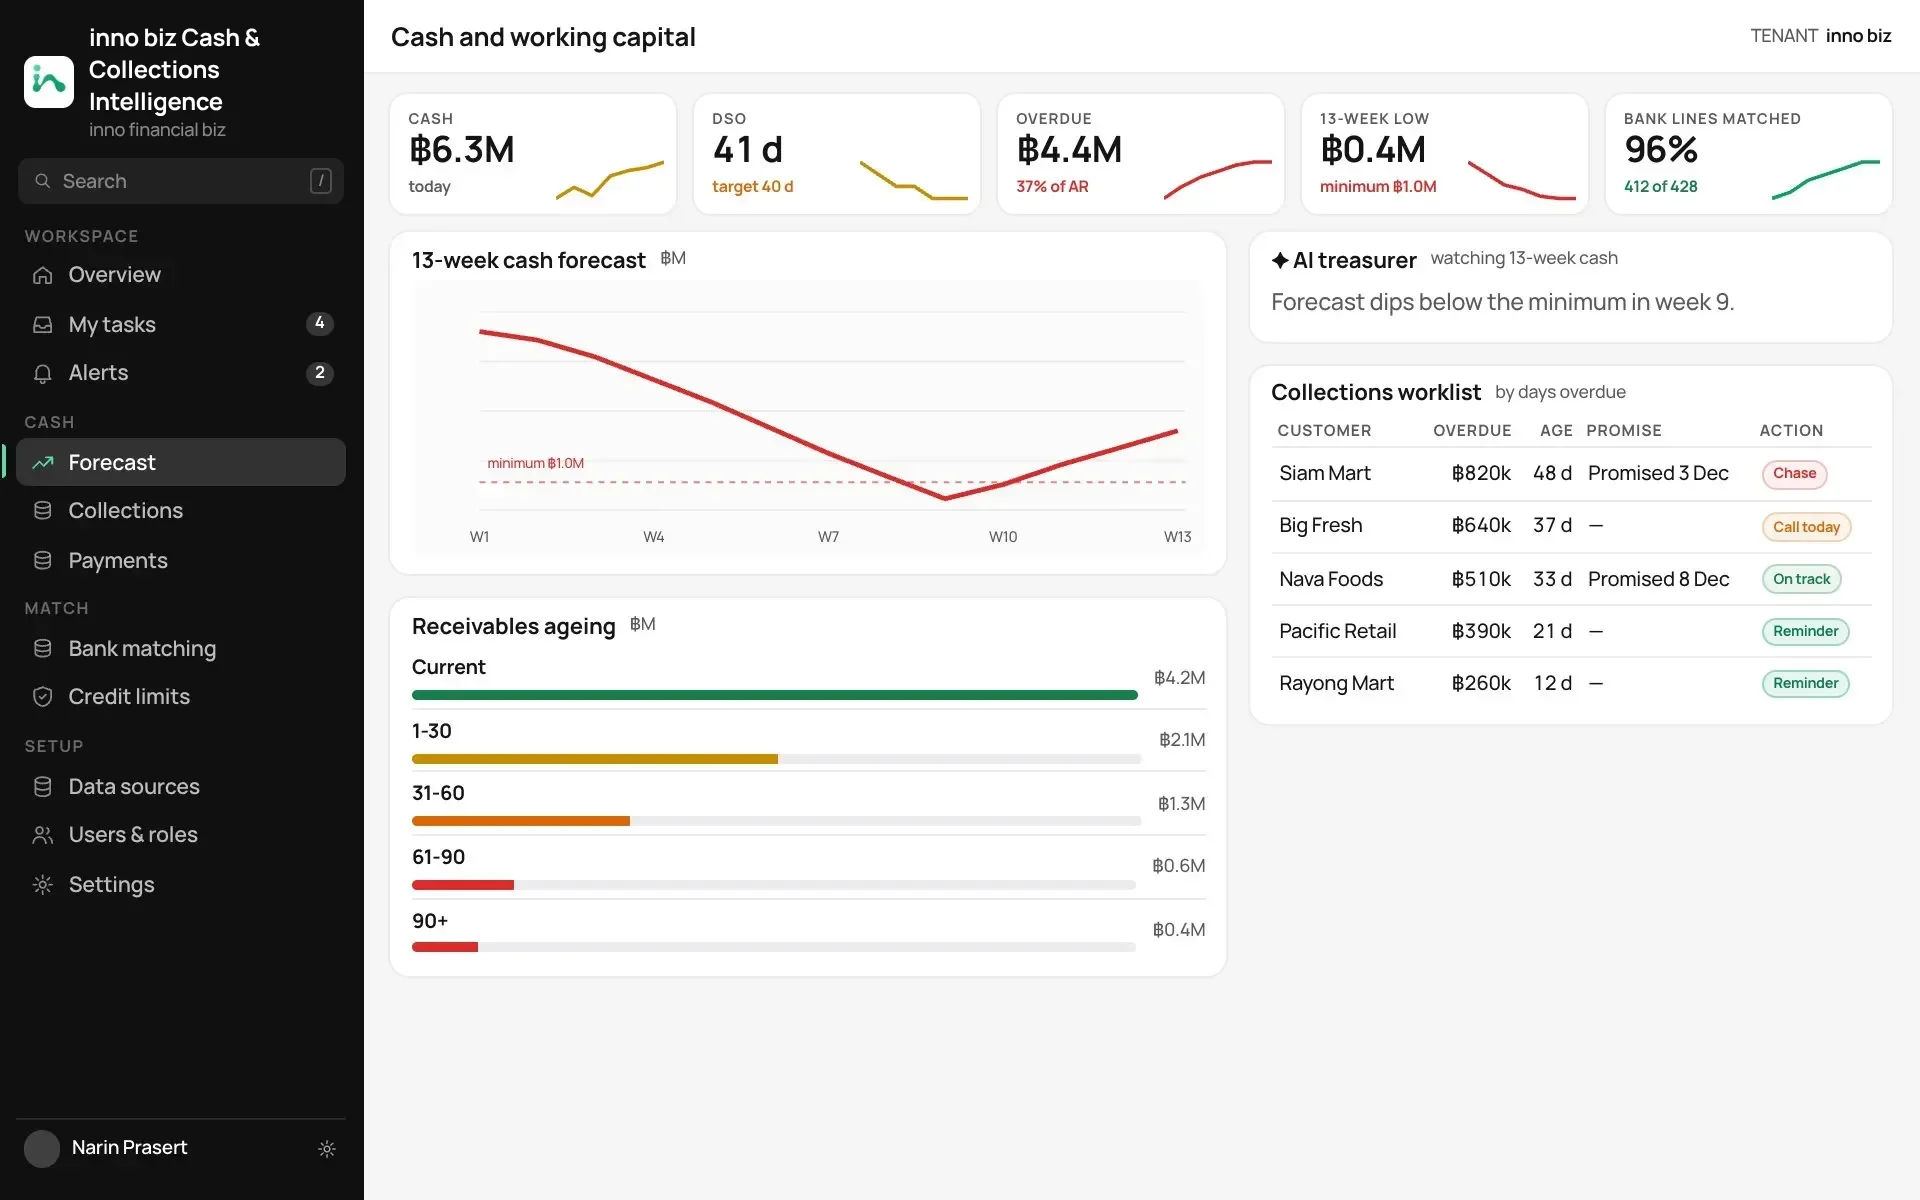
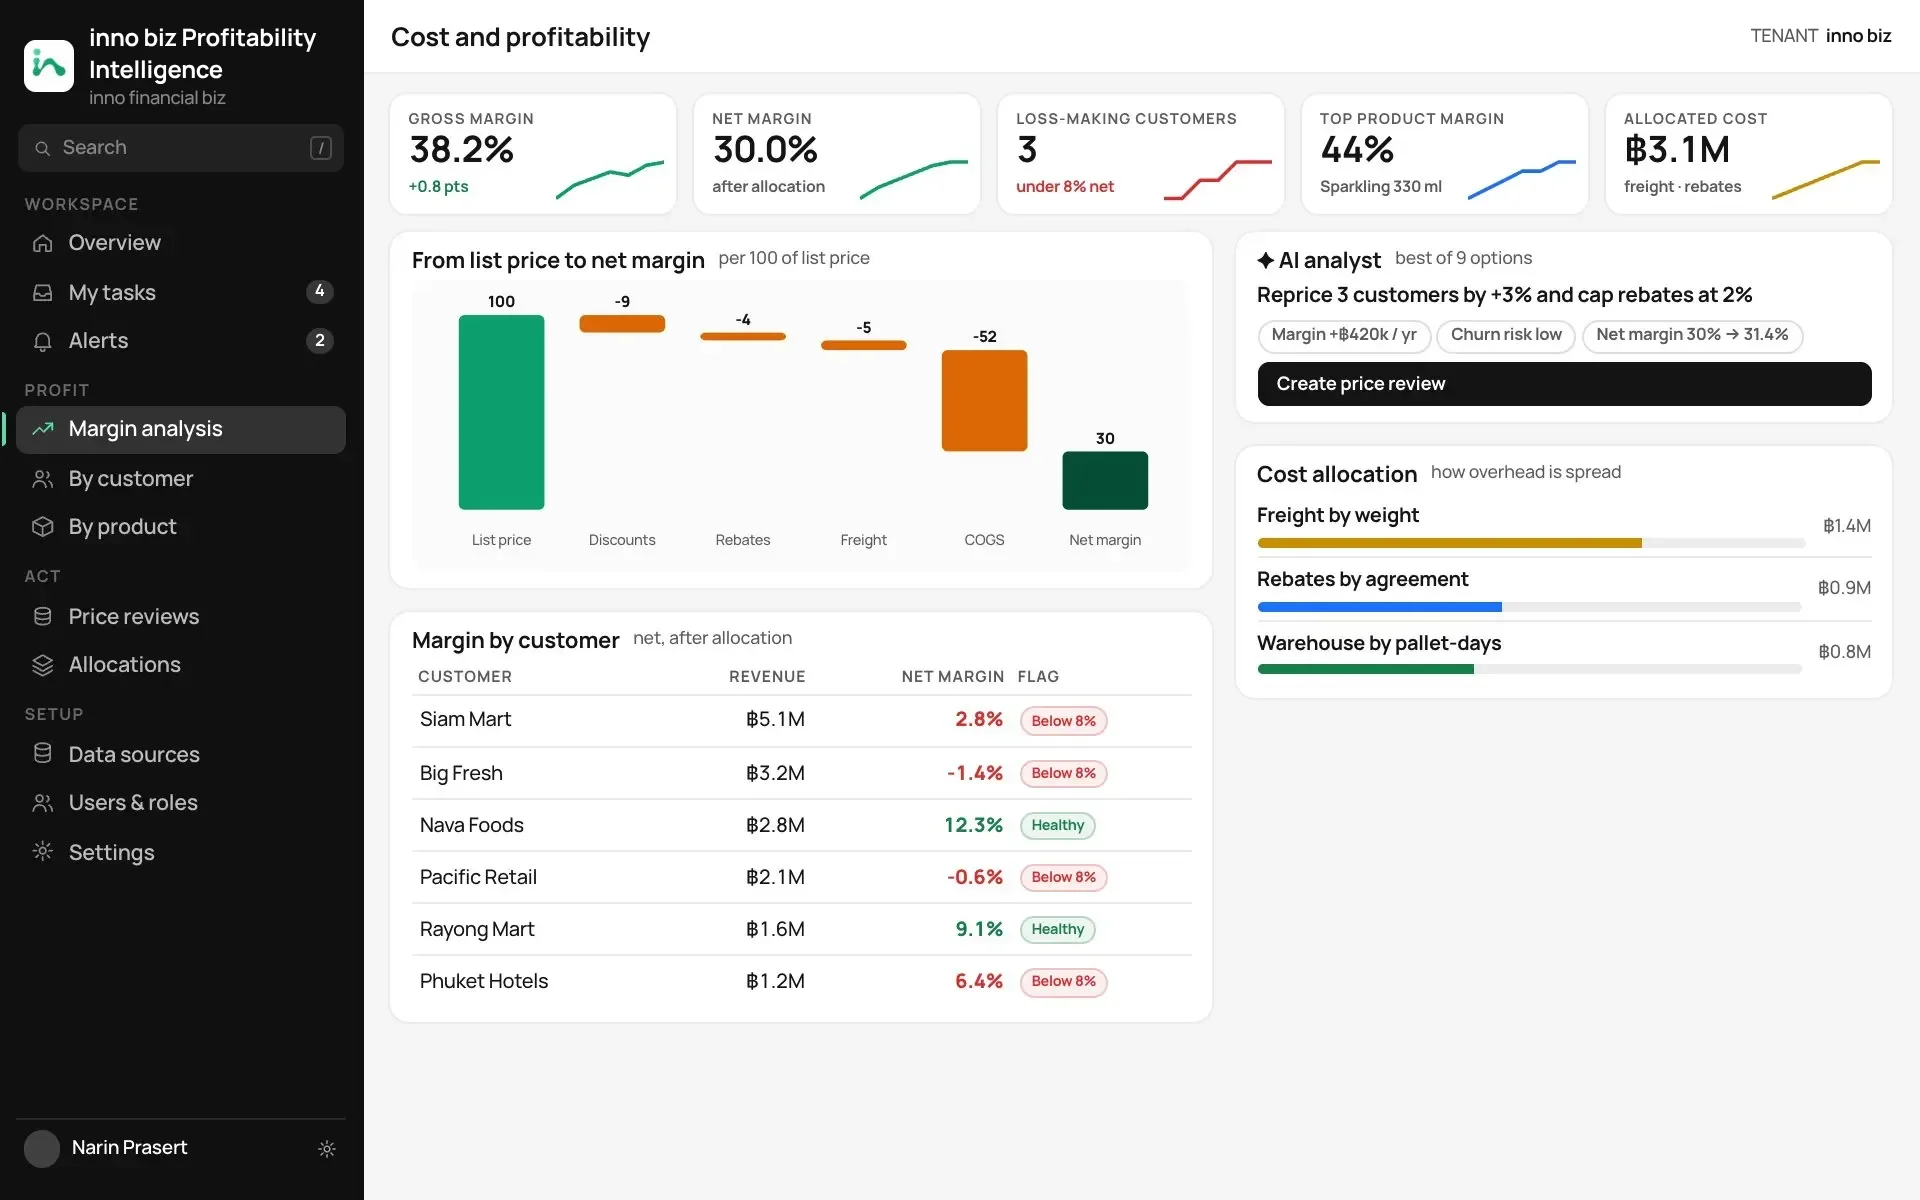
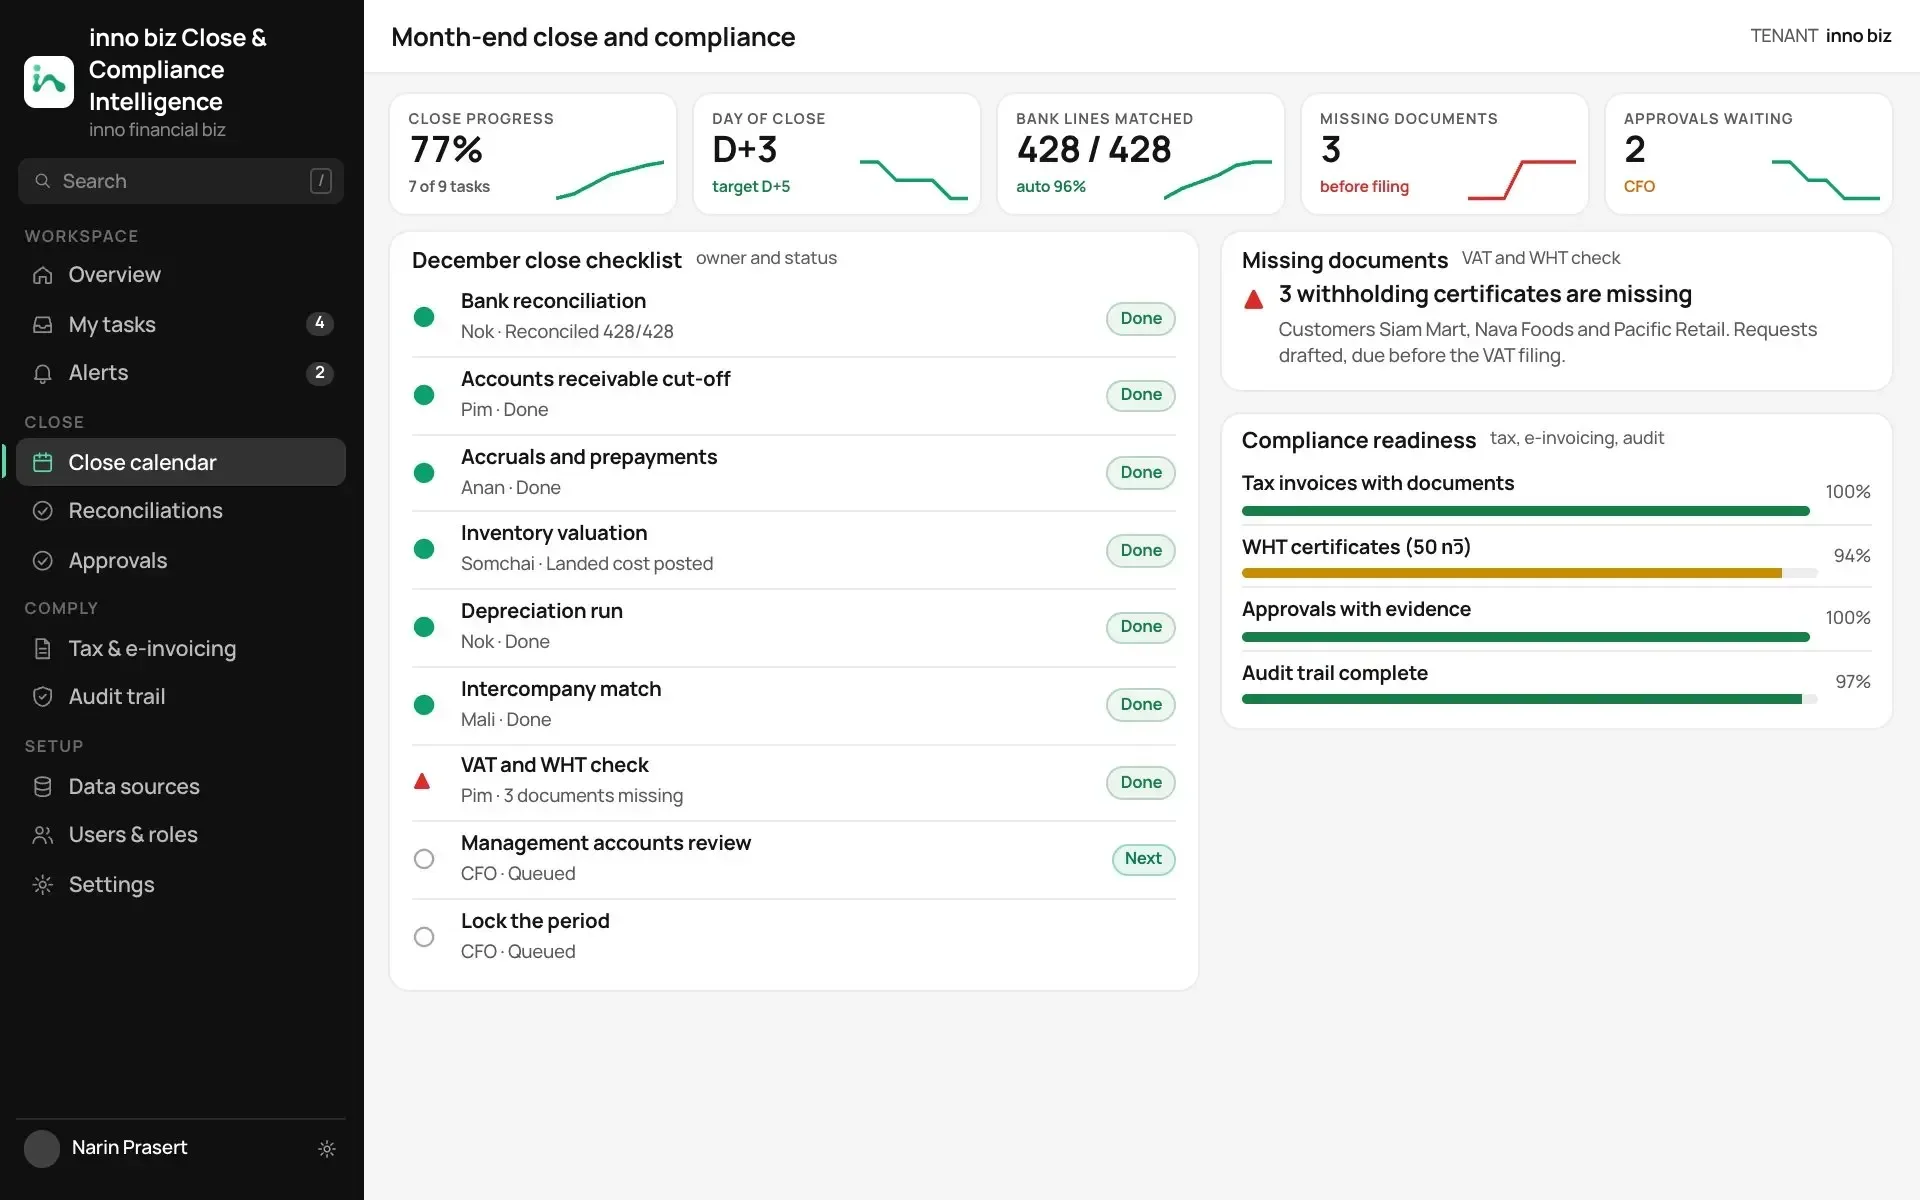
Use the menu on the left, or the tabs below — every screen is a page of the product, with sample data.
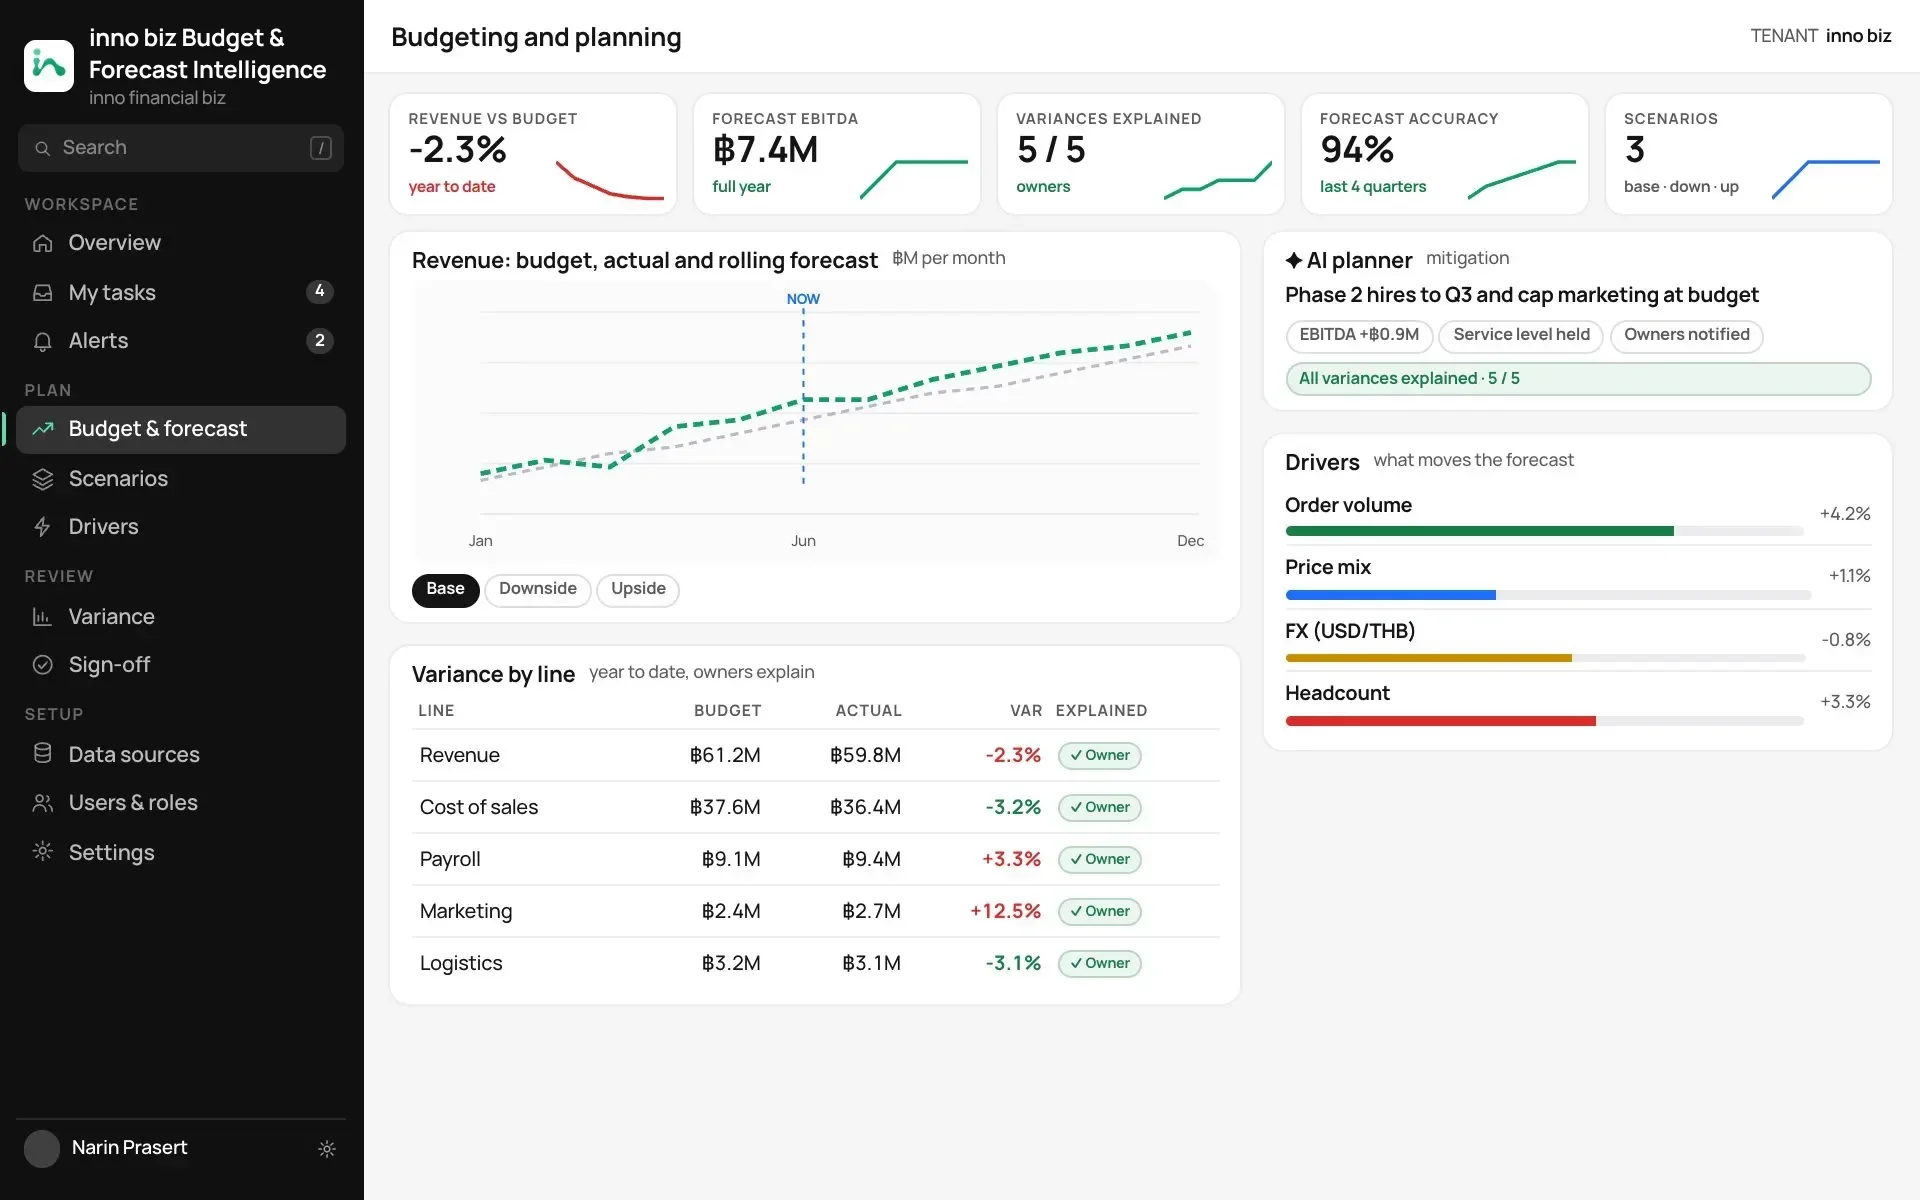
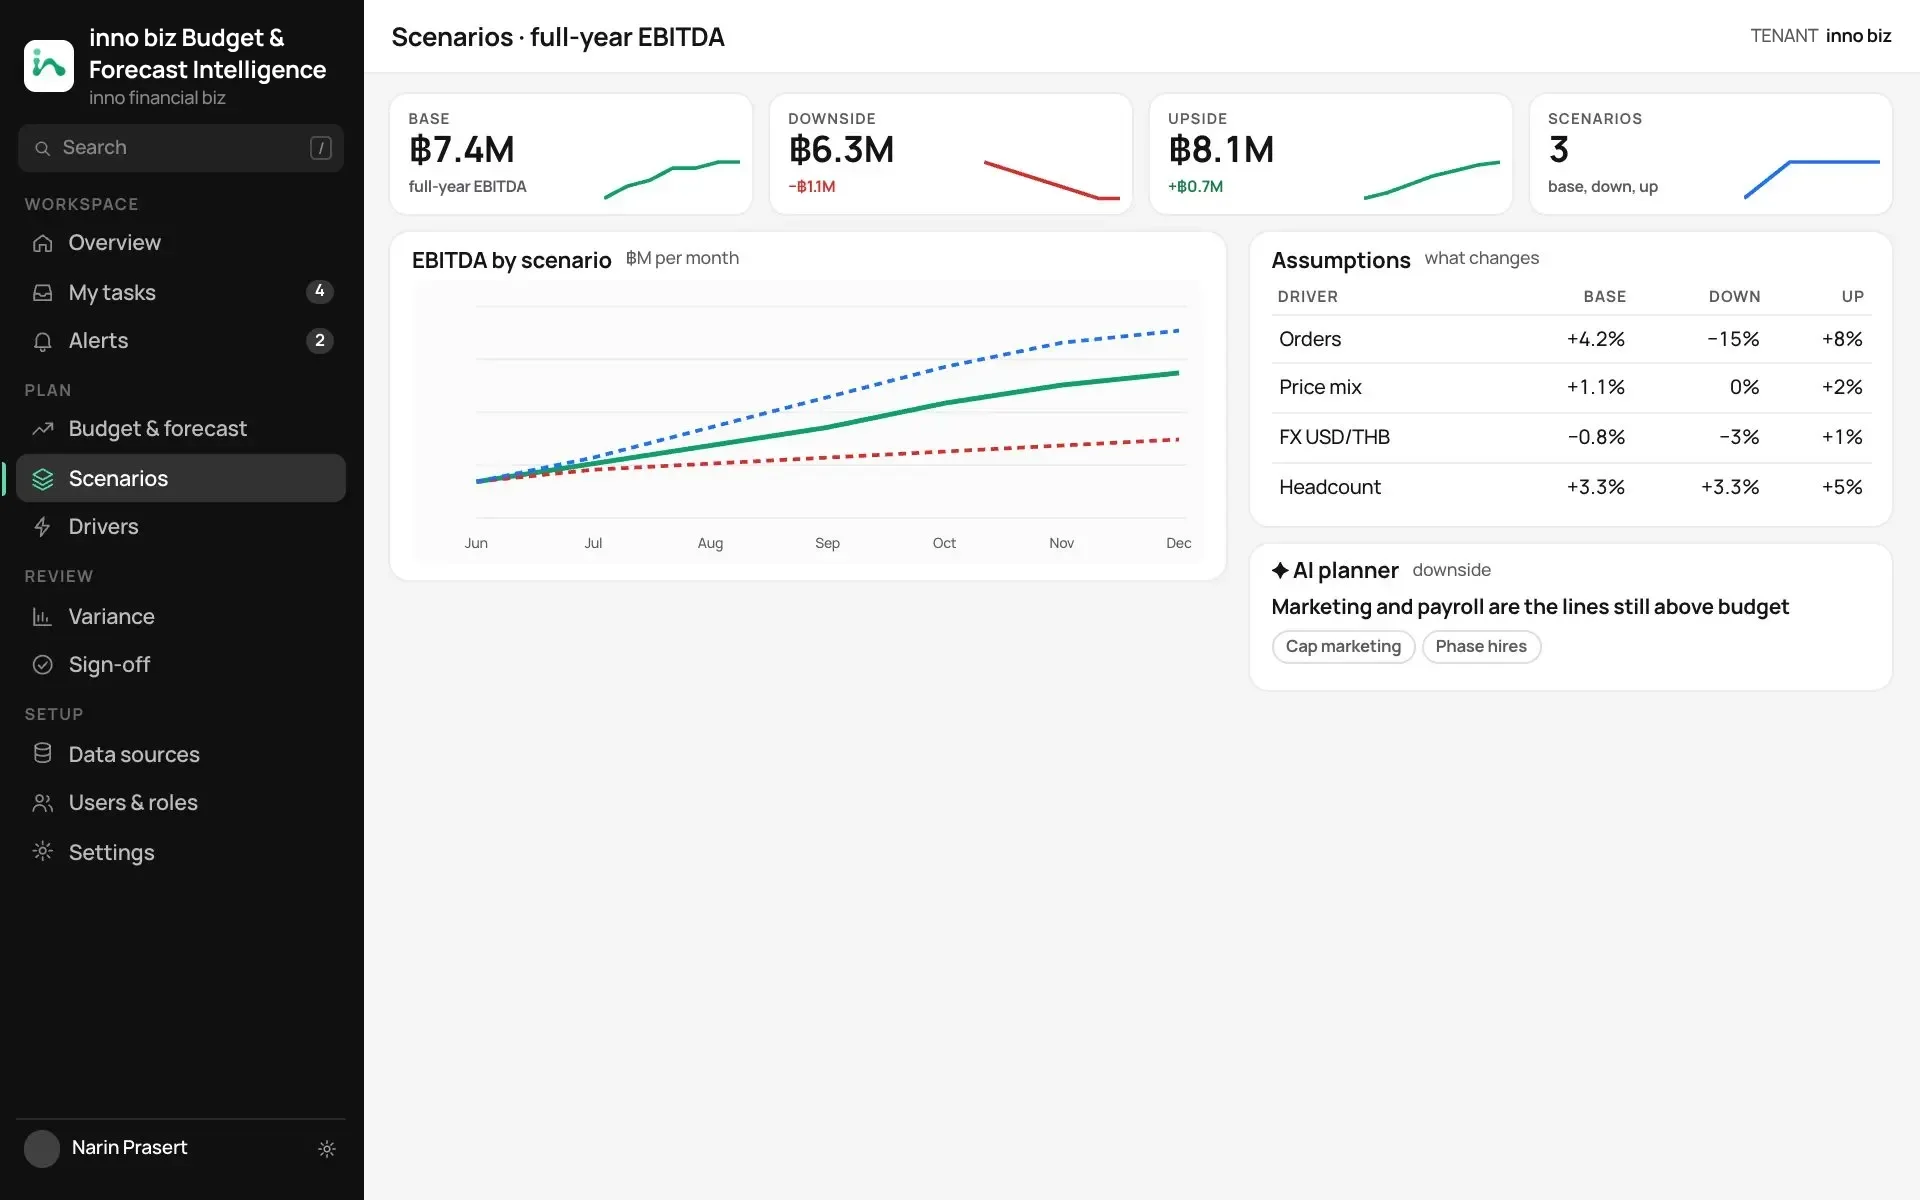
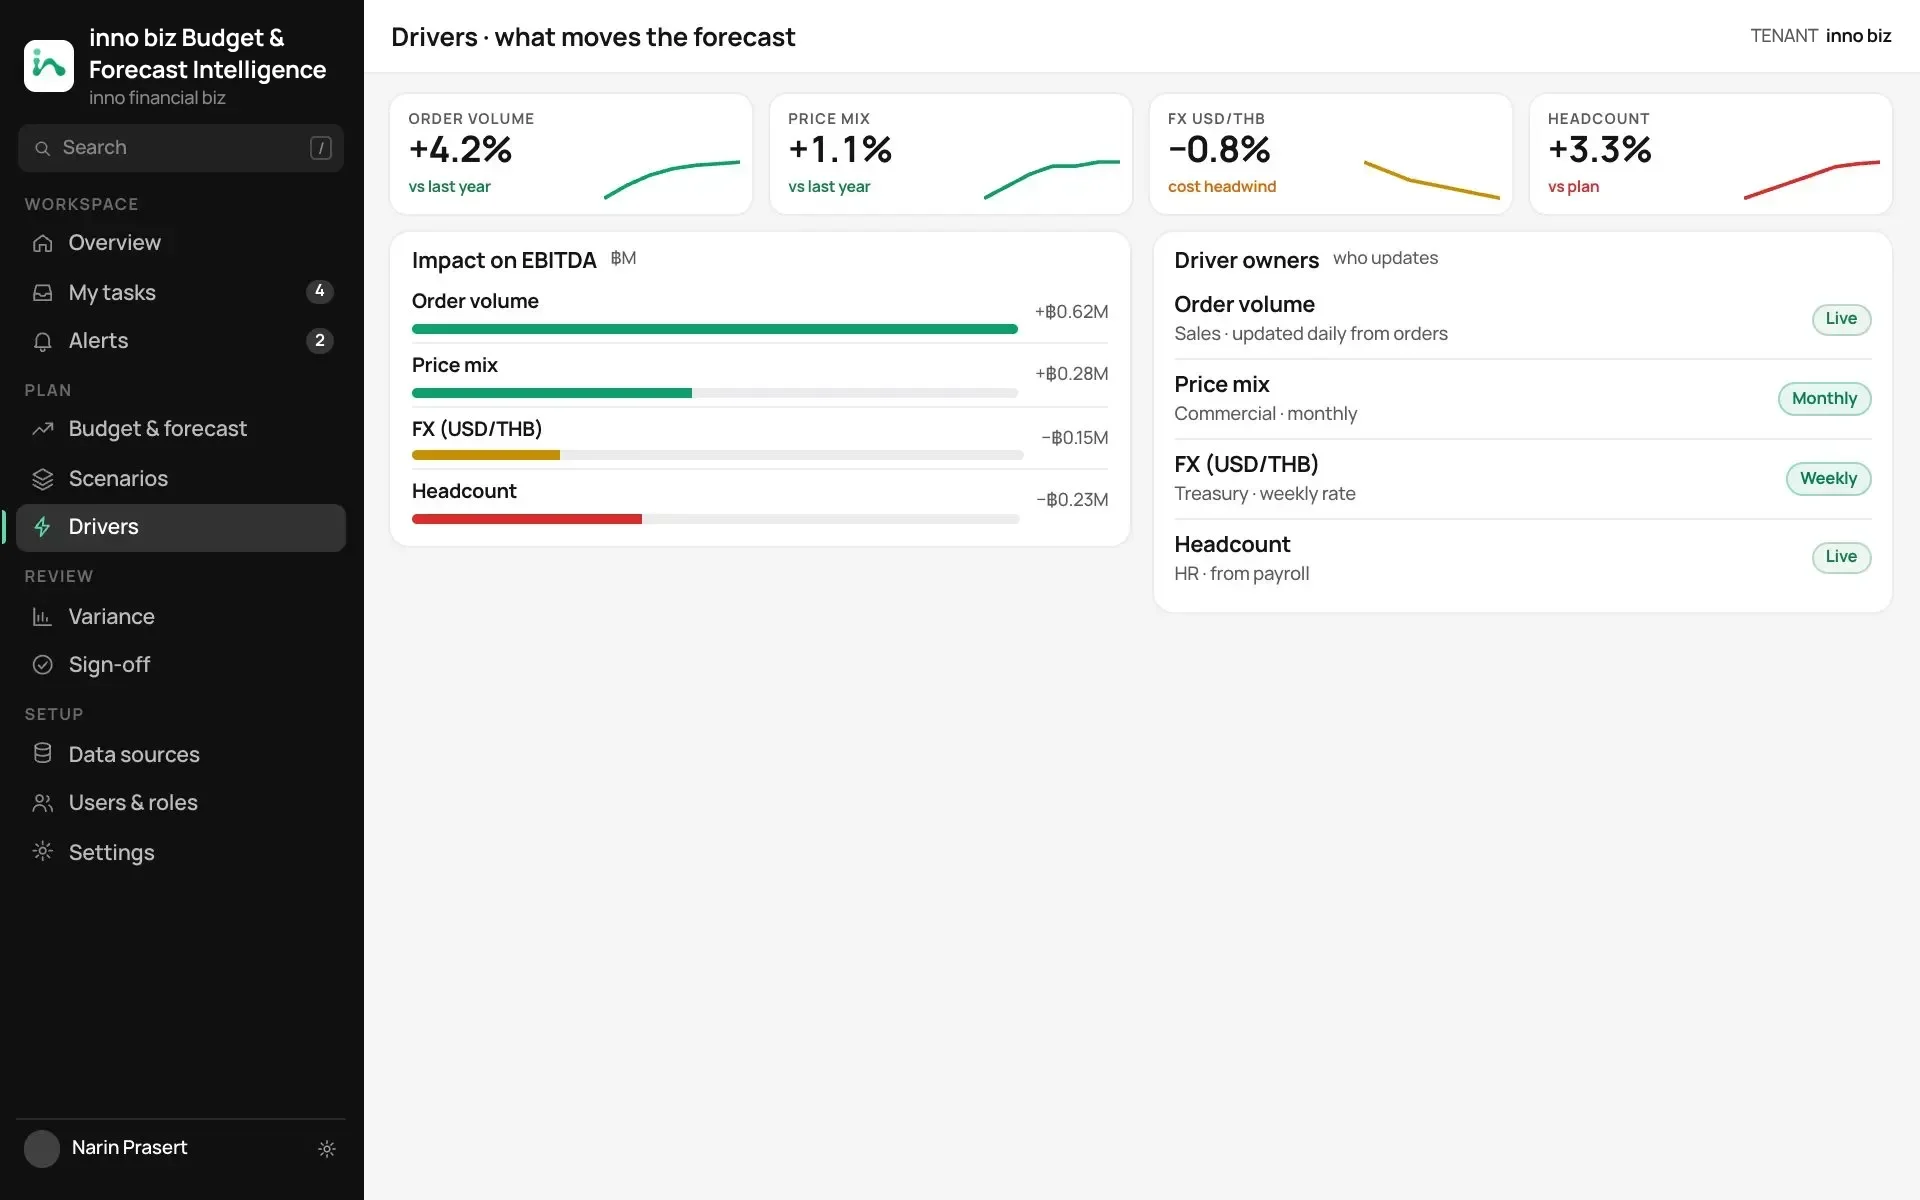
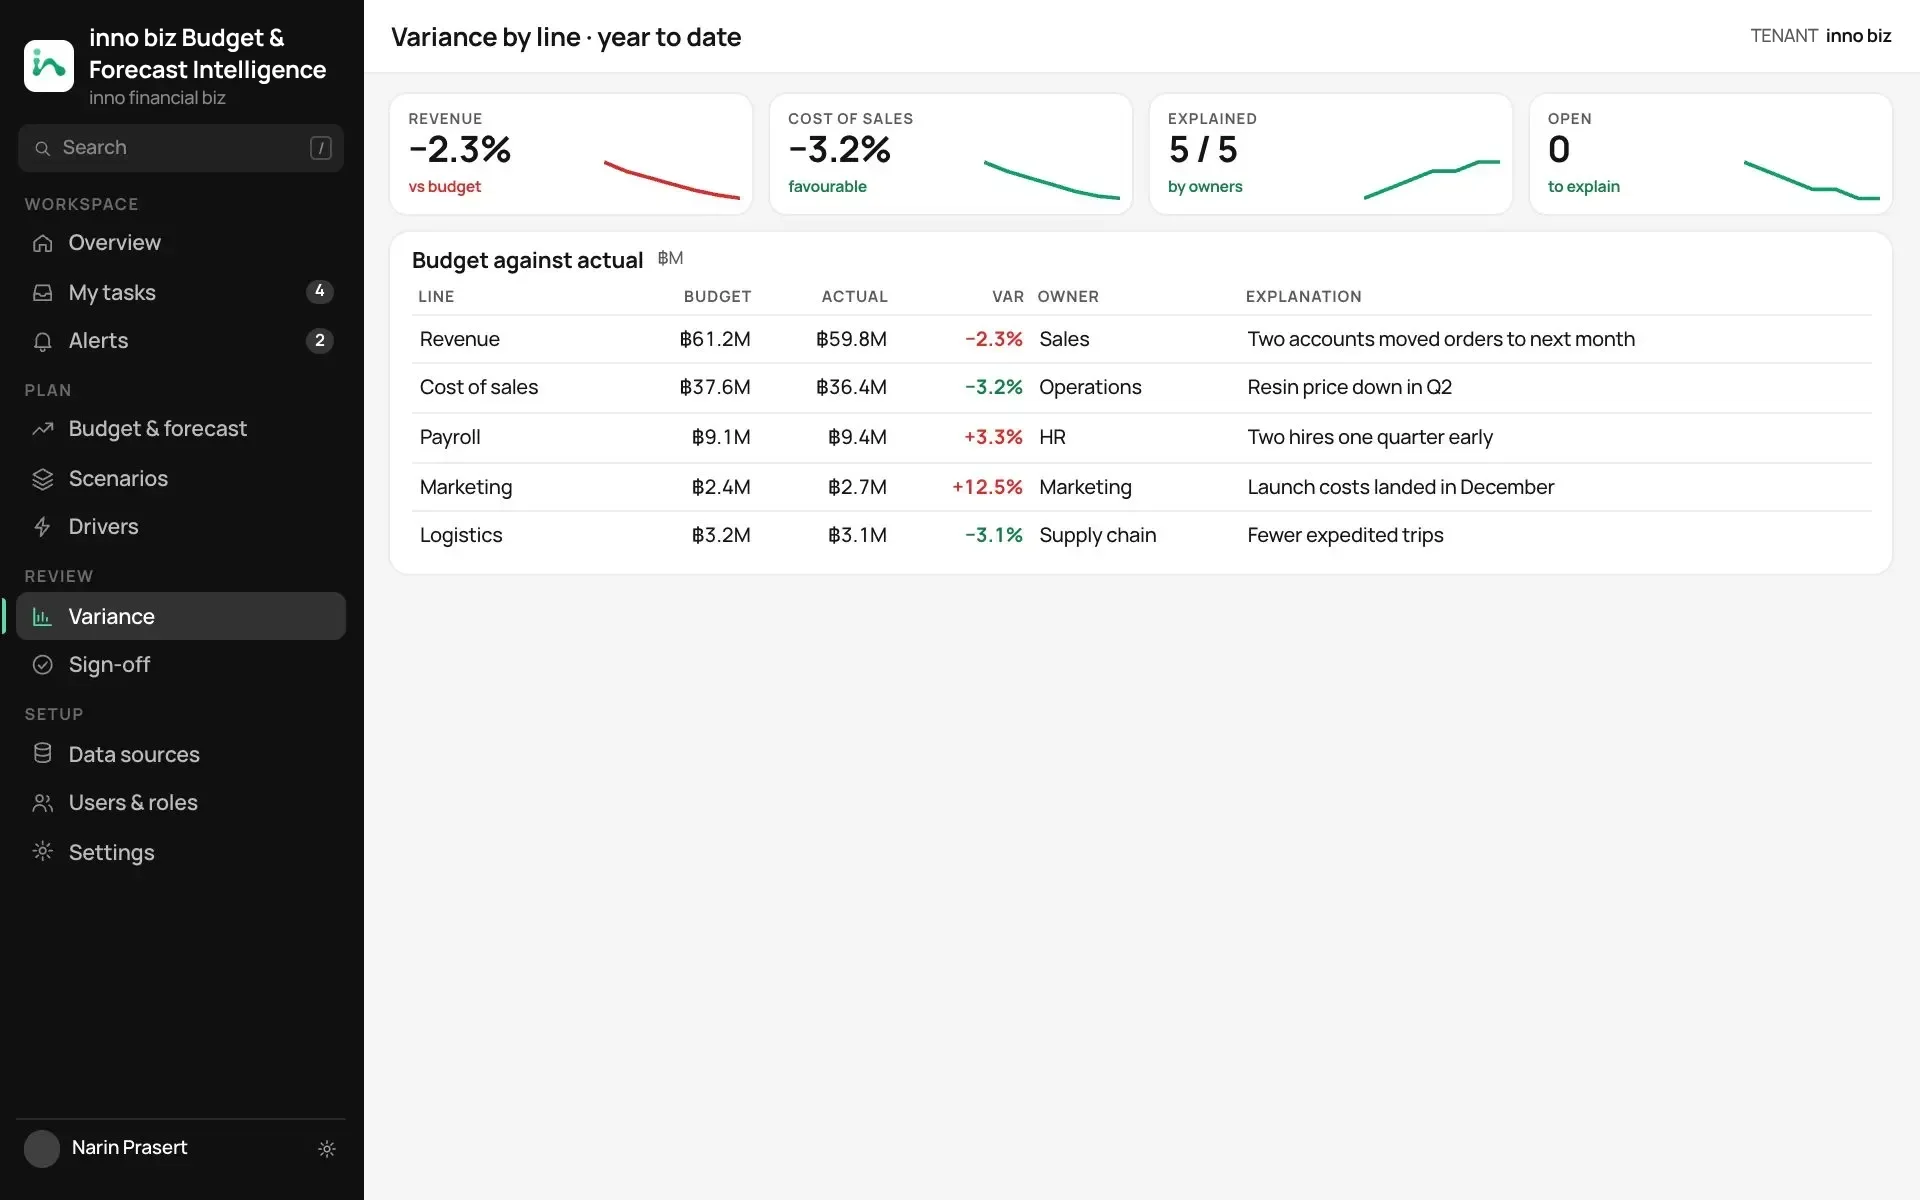
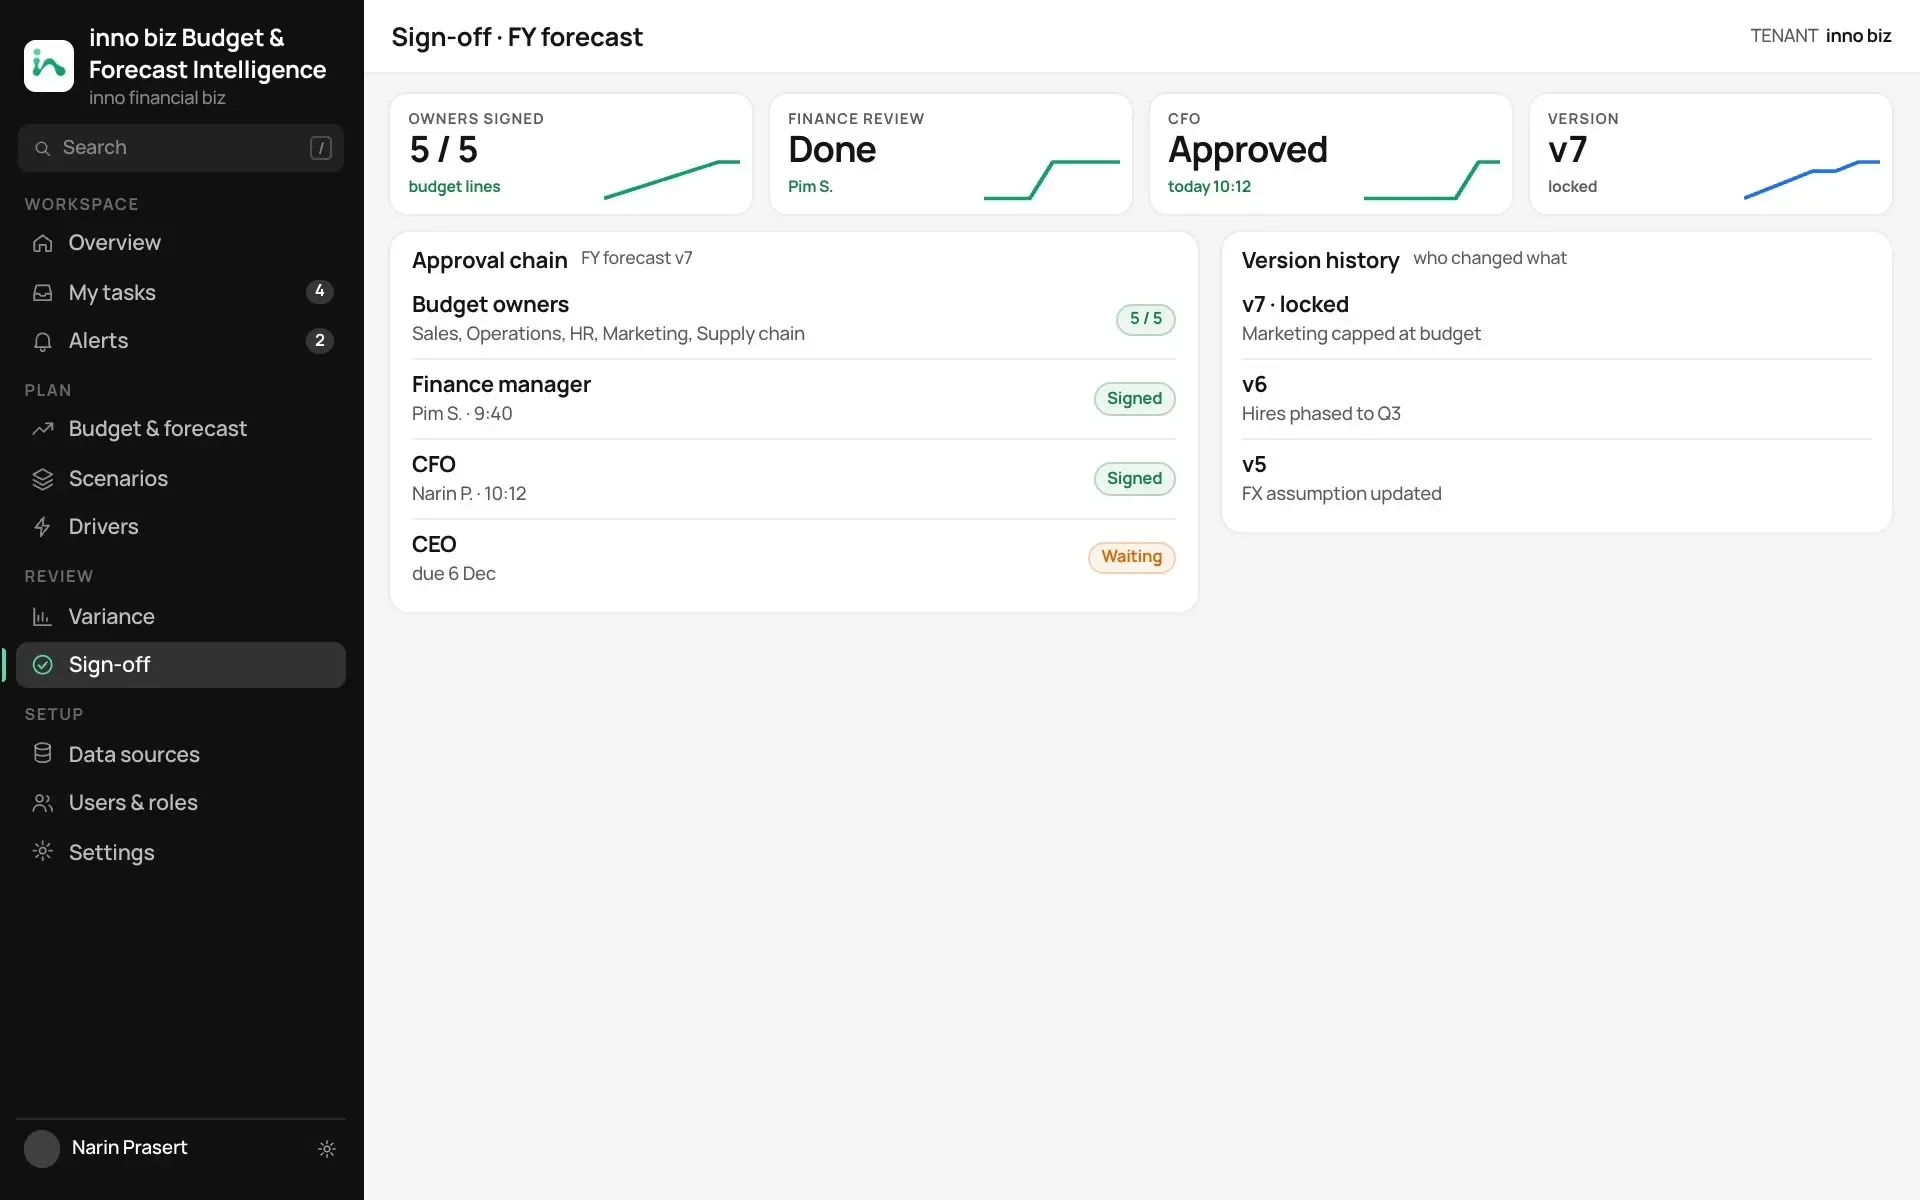
Budget & forecast. Budget, actual and rolling forecast, with variances explained by owners.Scenarios. Base, downside and upside side by side, with the assumptions that differ.Drivers. The few drivers that move the forecast, each owned by a person.Variance. Every line against budget with its owner’s explanation.Sign-off. The forecast signed off by every owner, with a full version history.
Budgets, actuals and figures on these screens are sample data to show the idea.